Data Warehouse Architecture
Last modified: January 23, 2020 • Reading Time: 9 minutes
When multiple people ask the same question using the same data and get varying answers, it creates doubt in all of the data in your organization. Additionally, it’s demoralizing for everyone and time-consuming to figure out the right answer. Unfortunately, this is typical when data has not been cleaned up into a Single Source of Truth.
People get inconsistent results because:
- Data sources change
- Schemas are overly complex
- Table and column names are confusing
- Metrics need to be derived from the data
What is a Data Warehouse Architecture?
A Data Warehouse is a database where the data is accurate and is used by everyone in a company when querying data.
The promise of a Single Source of Truth is accuracy across your organization.
This is an obvious thing that any company wants, yet a lot of companies struggle to deliver. Creating a Single Source of Truth requires data engineering effort. Let’s explore the problems that a Single Source of Truth solves, issues to watch out for, and best practices.
Data Sources
Before you even build a Single Source of Truth, your company will likely have data sources that overlap in terms of what they track. You will also have data from dormant data sources in your Data Lake that is still needed for certain analyses.
Imagine you were tracking sign-ups via Hubspot and after a year you decided to switch to Salesforce. That means that prior to your switch, the Salesforce data will be empty. Moreover, the Google Analytics data might not be as well synchronized between your Hubspot data and your Salesforce data. When an analyst attempts to query for sign-ups, it will be unclear which data source they should use.
Consolidate Data Sources
When your company has used multiple tools to track the same type of data, if you can, migrate the data from the previous tools into the latest tool. If this is not an option, use the data warehouse to create a table which UNIONs the data from both sources. This ensures the historical records are not lost and creates one location for relevant metrics. This will require some renaming and cleaning to accomplish.

In addition, if you want to maintain access to old/unused data sources from your Data Lake in your Data Warehouse, you can label data sources as deprecated or approved to help guide people during their analysis.

Simplify the Schema
In a Data Lake, the schema reflects in transactional logic of an application and follows best practices (such as a 3rd normal form) so that updating values will not produce errors. But this type of schema can be difficult to navigate and many tables will never be used in an analysis. In the past, books recommended using dimensional modeling to reduce the schema complexity, make it easier to run queries, and enhance performance. Today, due to advances in BI tools such as Chartio and Data Warehouse technologies, dimensional modeling is no longer worth the effort.
Simple Schema
We create a Single Source of Truth by creating views on top of the existing schema. There is no need to move away from 3rd normal form. The main thing we want to do to simplify the schema is to exclude tables from the new views that only contain app specific logic and are not useful for analysis. If you want to make it even easier to work with a specific set of data, you can create a wide table (view) that does all the joins. This can sit alongside the cleaned up normalized version of the Data Warehouse.
Simplify Tables and Columns
Table and column names are typically created by engineers to be used by the application the data comes from. Table names, column names, and even a column’s purpose for being in the table can be confusing to others. This makes it challenging for business users to analyze the data without consulting the engineer. We can review the table we referenced in Why Build a Data Warehouse:
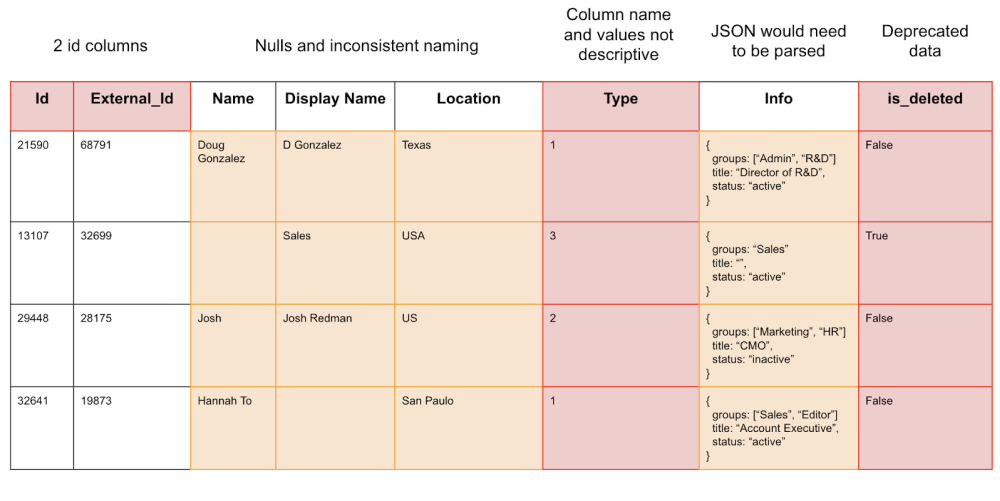
- Having multiple Id columns can be confusing.
- Nulls can produce unexpected results during aggregations.
- Inconsistent naming reduces confidence that the data is correct, and makes it hard to aggregate and group the data.
- Non-descriptive Column names and values will require the analyst to ask an engineer for clarification.
- Most analysts are not able to use regex to parse out valuable information from JSON data.
- Deprecated data flags are often missed by analysts, so this leaves room for error in aggregations.
To address these issues we need to keep the analyst/business user in mind and make all of the fields easy for them to interpret. The first step is to develop guidelines for how you want to clear up the data.
Naming convention and style guide
When going through and recreating the schema with views of the relevant tables you should also clean up what’s in each table. Exclude irrelevant columns and rename any columns that are confusing. Naming conventions help people analyze data consistently because they clarify what each column is and how it can be used.
Simplify
It’s quite common for raw data to be extremely complex. Data was typically meant to be consumed by applications and not directly by business users. By taking some time to simplify data, we can greatly improve business user success when querying.
| Best Practice | Reason |
| Only include fields with obvious analytical purpose | It's best to start modeling with only the most relevant columns, excluding any columns that has no immediate or obvious analytical purpose. |
| Extract relevant data from complex data types | Application data sources may contain JSON, arrays, hstore and other complex data types. These are typically hard to query from business intelligence tooling and should have relevant data extracted into new columns. Example: Supposed a table books contains an id column and the following JSON column. { |
| Change flags and cryptic abbreviations to meaningful values | It's common for application databases to have flags or cryptic abbreviations in columns that work well for the application and terrible for a business user. It's important to transform these values into easy, human readable values. Some examples:
|
| De-normalize where possible |
Applications typically have highly normalized tables to prevent duplicates, reduce space, and make modification easier. This typically makes it harder for business users to browser the schema however because the complexity of the joins may be hard to follow. Build wider tables where appropriate, collapsing common concepts into a single table. Some examples could be:
|
Cleaning
Data is messy and requires some cleaning to ensure accurate results. Cleaning prevents common problems that might cause a query to produce incorrect results.
| Best Practice | Reason |
| Attempt to eliminate NULLs |
NULL values have unexpected consequences in SQL (is "string" <> NULL?). It's best to replace all nulls with values. Some examples:
|
| Fix common data inconsistencies |
Bad data always makes its way into raw data sources. Whether it is misspellings or just junk data, it is important to clean up the data as much as possible. Some examples:
|
| Follow Naming Conventions | Schemas, tables, and columns should all be named in accordance with naming conventions listed below. At a minimum, names should be human readable and be representative of the data type and values stored. |
| Remove irrelevant data |
Rows that are irrelevant for various reasons should be removed entirely from the data set. Some examples could be:
|
| Change Data Types | Modeling is a great time to change data types to more appropriate types. Unix timestamps could be converted from int columns to datetime for example. |
Naming Conventions
Initially there will be a variety of naming conventions used for tables, columns, and values. Creating a standard for all of these makes it easier for others to find and understand the data they are looking for.
| Best Practice | Reason |
| Plural Table Names | A table of Leads should be titled "Leads" not Lead. When there are more than two words on the last needs to be pluralized: opportunity_histories |
| id as primary key | A simple numeric primary key labeled id should be standard for all tables. |
| foreign keys follow \[tablename\]_\[id\] format |
ForeignKeys should follow this format to make it very clear on where the table is linking to. If there are two foreign keys to the same table you can preopend a name to them following the format: \[uniquename\]_\[tablename\]_\[id\]. An accounts table linking to a users table with both a billing contact and a main owner would look like this: Accounts owner_user_id billing_contact_user_id |
| Start columns with a _ if they are needed but should be hidden for Visual mode. |
If there are columns you need in the model for joining or other purposes but don’t want visible by default in visual mode you can prefix them. They will otherwise be treated just as any other column. Let’s say you didn’t think the foreign keys in the accounts table above needed to be shown in Visual mode. You can simply prefix them as shown below. The relationships will still be detected. It’s a best practice not to show the foreign keys visually. Accounts id name _owner_user_id _billing_contact_user_id This should not be used for columns you're on the fence about needing. Those just shouldn't be included. These are for columns that are needed for querying purposes but have no use in a Visual setting - primarily foreign keys. |
| Lower case, underscored naming | Our data model needs to be easily editable in SQL mode so we should follow conventions that make editing raw SQL easier. Therefore, we should attempt to have column names like id, first_name, last_name, and last_login_type instead of more human readable forms in the model. Chartio will handle that conversion. |
Publish a style guide and distribute it among all of your employees to make adoption of known terms much easier.
Metrics
There are a lot of different ways to measure how a business is performing. Some are fairly well known, such as Monthly Active Users or Number of Trials Started. In most businesses, getting an accurate count on a metric is difficult because you need to filter out irrelevant data:
- Test accounts
- Internal Company emails
- Non product-related page visits
- Users that are no longer employed by a client company
Not filtering out the right data will negatively affect your analysis. Presenting to others who have a conflicting analysis of their own will cause everyone to lose trust in the data.
Another more subtle problem with metrics is abbreviations. If Monthly Active Users is abbreviated as MAU in the database, it may be misinterpreted in someone else’s analysis. Do not assume everyone understands the abbreviation for the metrics you are reporting.
Create a Standard Metrics Dashboard
To define the calculation of a metric, create a Dashboard with this metric in it and provide text on the dashboard to explain how it was calculated and what has been filtered out. Make this easily searchable!

Another approach is to pre-calculate the metric in a view in the Single Source of Truth database. We recommend doing this through a SQL-based modeling tool such as dbt or Dataform. Defining the metric in the database will remove most, if not all, of the confusion.
To eliminate any remaining confusion on using the metric in your analysis, many SQL-based modeling tools can add a data dictionary to the data model. This allows the author of the data model to write out comments on why it was calculated that way and why certain data was filtered out.
Storing the metric in the database through modeling allows you to control changes in the data and the definitions systematically. You will still need to communicate changes, but they will be documented if anyone needs to check on their own.
Summary
- Create a Single Source of Truth and give employees access to it and only it
- Make your data intuitive through naming conventions and style guides
- Simplify the Schema by excluding app-specific logic tables
- Simplify table and column names: define them by their spoken language titles instead of technical jargon
- Centralize the control and accuracy of metric calculations through SQL-based modeling
References.
Written by:
Tim Miller
Reviewed by:
Matt David