Starting with Source Data
Last modified: February 13, 2020 • Reading Time: 4 minutes
Modern businesses generate tons of data. Product information, customer information, app performance, marketing expenditures, etc. You need to start organizing and analyzing data in order to run your business effectively. At the beginning of a business or while a business remains small, it is sufficient to work with data from production databases, product APIs, and financials directly from their original sources.
This stage is ideal for new companies or teams with minimal data needs. It is inexpensive and relatively easy to tool, implement, and maintain. It is sometimes exciting to build out a sophisticated data stack, but be sure to start here and check that it satisfies your needs before moving on; over-engineering is a costly mistake.
This stage is right for you if
- You have a small team with only a few people using data
- You have minimal data needs at the moment
- You only have data in a few small sources
- The only people who need to make new visuals are fairly technical
You’ve outgrown this stage if
- You have data you need to access in multiple places/applications
- You need unique or combined charts/dashboards for cloud application sources like Salesforce
- More than just a few people need access to this data
- You’re struggling with performance issues
- You have a set of data that’s getting too big for a transactional database
- Non-technical users need to create their own charts
Tools to Analyze Source Data
Data will live in many different places but the methods to analyze them boil down to Application Dashboards, Excel, SQL IDE, Cloud dashboarding tools, Business Intelligence (BI).
Application Dashboards
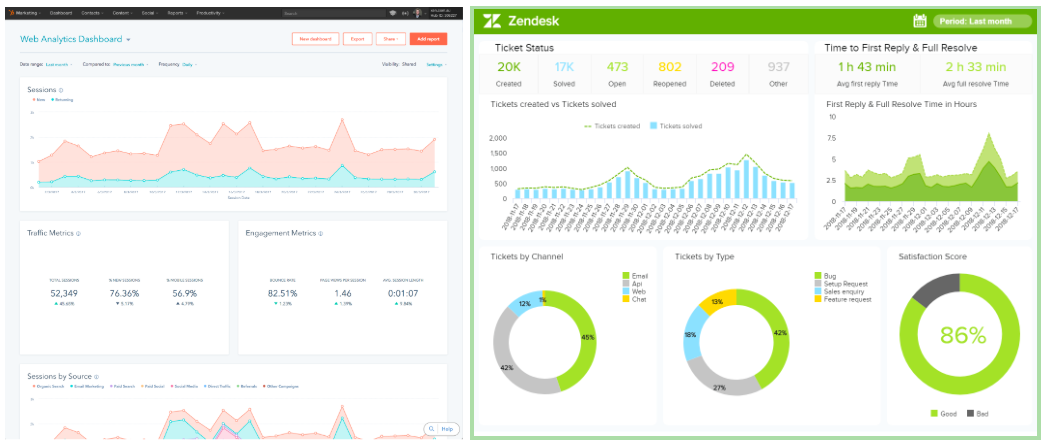
Many modern SaaS applications come built with the same set of fixed dashboards and visualizations to showcase the data they are capturing. These charts are highly tuned to specific use cases and can be quite informative - and maybe all you really need. Some, like Salesforce, even have customizable chart and dashboard creators built-in for high flexibility. These can take you a long way, especially if you don’t need to see this data in combination with other data.

These are also usually well supported by the vendor’s support staff should you have any questions or extra data needs.
Excel
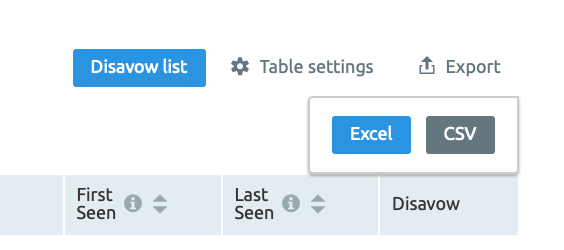
Many of the applications you are using will allow you to export some of your data into CSV formatted files. You can take this data and open it in Excel to analyze it. While this is an effective way to expand the questions you can ask of the data it is fairly manual and will need to be updated with new data often.

SQL IDE
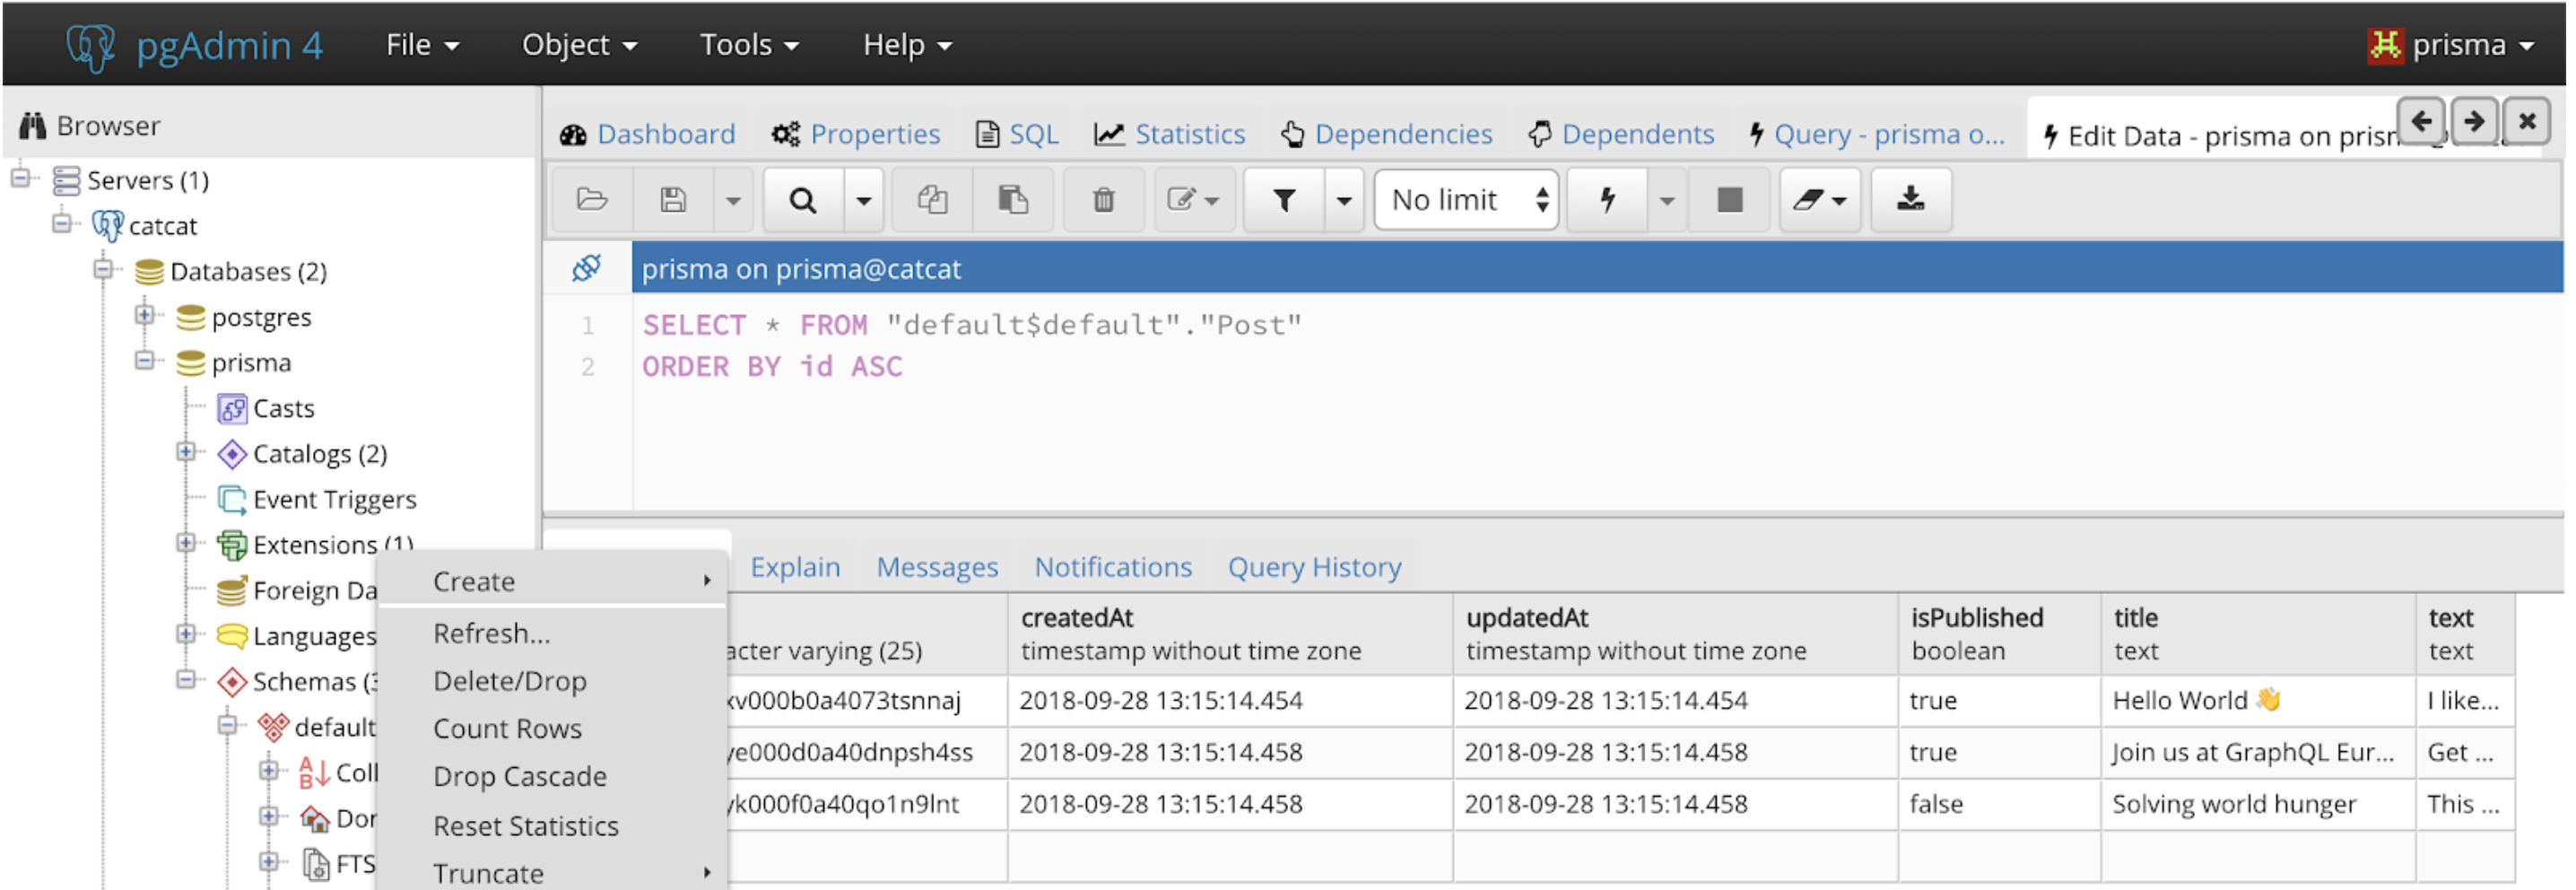
For data sources such as your production database, you can query it directly from the command line but this can get messy and hard to keep track of queries and results. We suggest setting up an IDE such as PG admin to better handle querying data within a Schema.

Cloud dashboarding tools
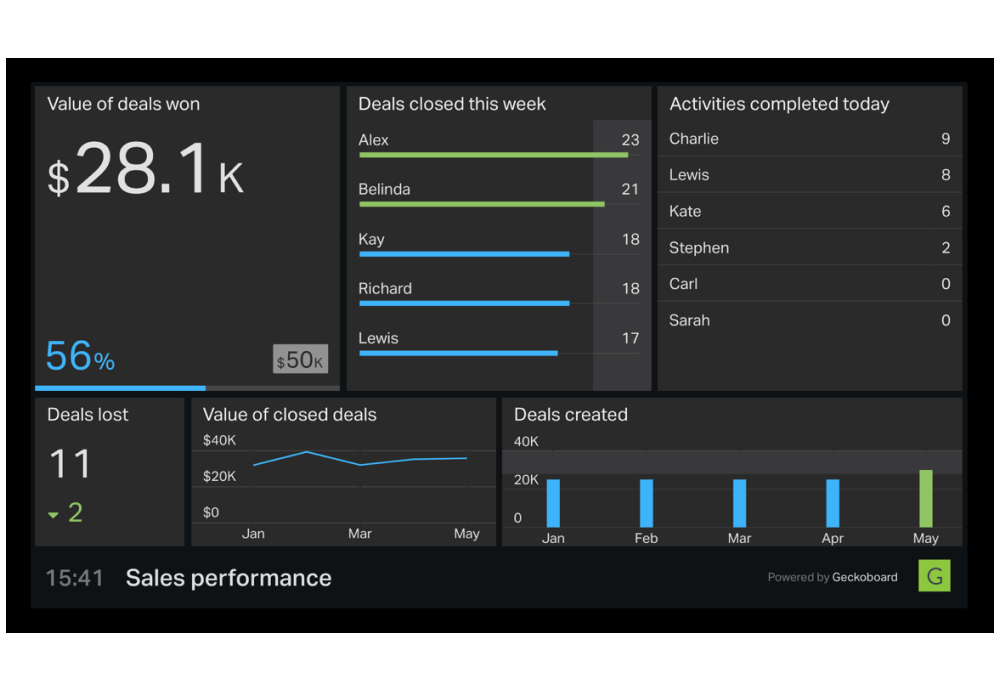
Tools like Geckoboard or Grow allow you to bring in data from cloud applications via APIs to visualize data in simple ways. This allows you to combine data from multiple places into a single dashboard, with simple visualizations to be viewed.

They often come with some nice default dashboards set up automatically for you, and can look great and be great for showing on TVs around your office, keeping teams aware of what’s going on. They will be limited in the ease and possibilities of their customizations.
Business Intelligence
For the most power in working with source data, use a flexible self-service Business Intelligence (BI) solution. For this stage be sure to choose an agile product, that allows direct SQL queries when necessary and ideally the ability to connect to and blend data from multiple sources. Those features will be necessary as your data hasn’t been consolidated into a single source yet, nor has it been organized in a clean enough way to not need occasional power of a complex SQL query. We’re obviously biased, but Chartio is a great choice here.
Summary
Every business has access to data, you need to find how best to view it and analyze it to improve your business. While you can use Application Dashboards, Excel, SQL IDE, or Cloud dashboarding tools; We recommend using a self serve Business Intelligence product to work with a variety of sources at once and be able to write SQL against your database.
Written by:
Tim Miller,
Matt David
Reviewed by:
Dave Fowler
