Source Data Best Practices
Last modified: October 29, 2019 • Reading Time: 5 minutes
If you do get to the stage where you are utilizing a SQL-based BI tool to blend and analyze your data, you should be aware of some helpful best practices. At this stage, with few people exploring the data, it is not recommended to spend a lot of time doing modeling or clean up. However, the following agile best practices will prove helpful.
Keep a complexity wiki page
Instead, keep a document or wiki page with warnings about known complexities in the data so that you and others who are training-up can reference and share knowledge. Some example things to keep track of are:
- Descriptions of poorly named columns and tables
- Columns with nulls or largely useless data
- Business logic
- Complex or confusing join paths
- Old or unused columns and tables
Snippet Dictionary
Another useful document to keep is a dictionary of base queries or snippets for common metrics. When working with data that hasn’t been modeled yet, you end up having to repeat a lot of the same filters over and over again. It’s helpful to be able to grab those easily when needed, rather than re-create them each time.

These can be stored on a wiki, .sql file, or even as a dashboard of these queries saved as charts. With the right BI product, the dashboard method is ideal, as these snippets are rendered as starter charts that can be easily duplicated and adjusted.
Along with the snippets, it is a best practice to add comments describing how the metric was calculated. These snippets and comments will be a starting point for data models at the Warehouse stage of data sophistication.
BI Layer Meta Modeling
Agile BI products will allow you to do some light modeling of the data at the BI layer. In Chartio for instance, there is a Schema Editor that enables you to quickly rename fields, hide columns, specify join paths, and create custom columns or tables. Time here can be well spent, but if you’re doing too much of it, consider moving all the way forward to the Warehouse stage where your efforts will be more universally applied.

If you’re using Tableau, they have a feature called Data Interpreter that will do this as well.
Visual, Drag & Drop Exploration
In addition to SQL access, some BI products with drag and drop data explorers such as Tableau Desktop or Chartio’s Visual SQL will handle writing the SQL for you. Generally exploring data visually is much faster and more intuitive than writing raw SQL. Visual interfaces will handle changing data format strings, join paths, new groupings, unique dialects, etc. which will automatically you a lot of googling and debugging.
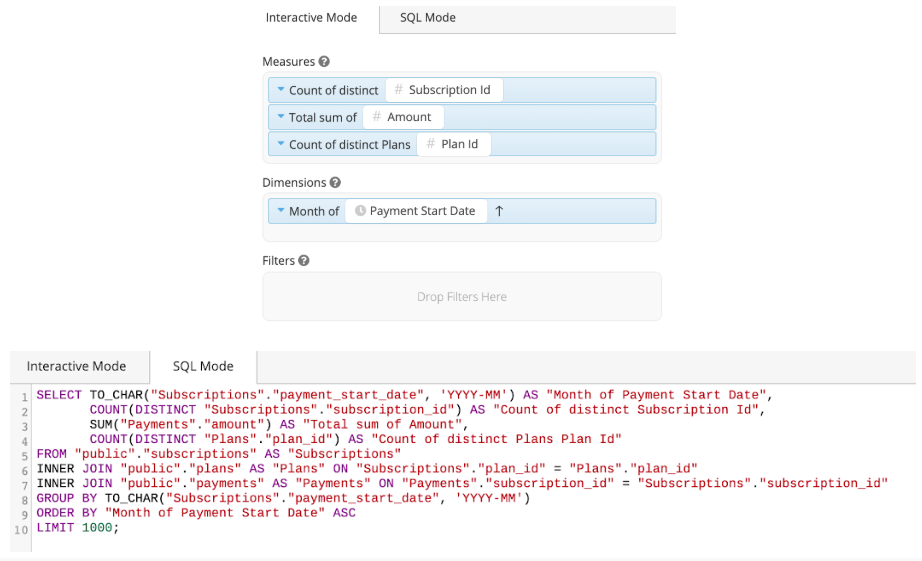
Especially at this source stage, you may be dealing with sources in multiple SQL dialects, and a few different APIs. Remembering the syntaxes for all of these sources is just not realistic. One of the largest benefits of these visual interfaces is that they operate in the same way, regardless of the source, and write the correctly formed SQL for you.
These interfaces will be even more useful on top of clean/modeled data in the warehouse and mart stage where you’ll enable more people in your company to explore data and answer questions on their own.
Double Check Results
Whenever you are producing visualizations, unexpected or null values can make your analysis incorrect. Always do a quick review of the raw data by sorting each field to see if you need to remove, ignore, or update nulls/outliers so that your analysis is correct.

Read this post on Finding Outliers with SQL
Keep short Dashboards
We’ve noticed that people have a tendency to keep adding more and more charts to existing dashboards. We get it, when you’re finding one insight at a time, it never feels like the right time to make a totally new dashboard. The result however is that you end up with really long, disorganized dashboards that run queries for each chart each time.

With a long dashboard, simply checking in on your dashboard to get the latest on one or two of your key charts is going to kick off hundreds of queries. We’ve written more regarding the best practices of keeping short dashboards here. In short, though, it’s best to organize them in smaller groups and create quick links between them.
Design before building
Another common pitfall is starting a dashboard by exploring data first. When you do this, you (while exploring) end up with a collection of what you thought were interesting facts but are in reality probably quite useless in daily monitoring. We’ve written a whole other book on this pitfall entitled How to Design a Dashboard.

In short - when creating key dashboards that you’ll be continually monitoring, first spend some time with pen and paper outlining exactly what you want to see and how. It will save you a lot of time and result in a considerably more useful dashboard.
Summary
Analyzing source data can be tricky since it has not been cleaned or modeled. That said, these best practices make it easy
- Keep a short, regularly updated snippet dictionary
- Use BI products to overcome data issues such as weird field names and complex joins
- Double check the data before visualization
- Keep shorter dashboards
- Design dashboards with pen and paper first
- Keep an eye on query performance if you are hitting the production database
Lastly, you should start exploring tools to pipe-in multiple sources of data that are not handled by your SQL-based BI tool to build your Data Lake.
Written by:
Matt David
Reviewed by:
Dave Fowler