Data Mart Maintenance
Last modified: October 29, 2019 • Reading Time: 6 minutes
Now that you have Data Marts set up, you will need ongoing maintenance to get the most out of your data. The first step is to establish a mayor per mart that will be responsible for carrying out the maintenance tasks for their mart:
- Communicate and educate the team
- Identify issues
- Identify new needs
Establish Mart Mayors
This role is similar to the Data Governor for the Data Warehouse. Data Governors delegate down to Mayors, who in turn, take care of Governor tasks at the mart level. Mayors, therefore, communicate with and educate the team using their mart. They are responsible for identifying issues in the data that exist in their mart. They also should be the ones creating requests to get more data sources or tables added to their mart.
An Ideal Mayor
Communicate and educate team
Different teams have different needs, but some common threads include teaching SQL skills or how to use your BI tool. Mayors should document and share data quirks that show up in common queries. Note, however, that you should try to address these quirks with modeling at the Data Warehouse stage.
We wrote a book on how to teach SQL if you need assistance in explaining how JOINs, Aggregations, or subqueries work.
Identify issues
There are two types of issues you will need to investigate as a Mayor of a Data Mart.
- Data that doesn’t make sense
- Common data errors
Data that doesn’t make sense
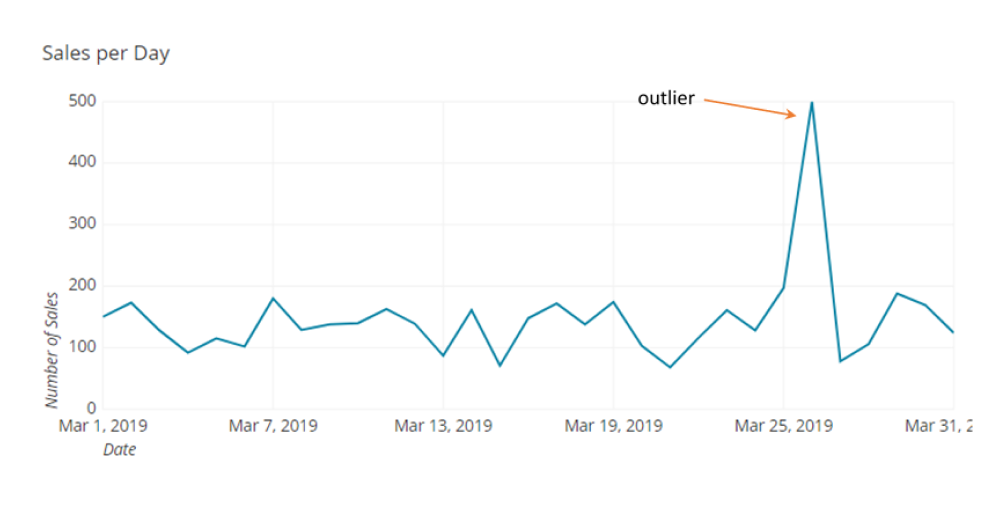
Spike
Something to pay attention to are numbers that are much different from the day before, but not caused by any changes on your end. If traffic to your website doubles in a day, it is likely caused by something and is not just a fluke. The spike may have been caused by a new marketing campaign, a bug, or potentially a Google search algorithm update. You should explore these possibilities in that order.
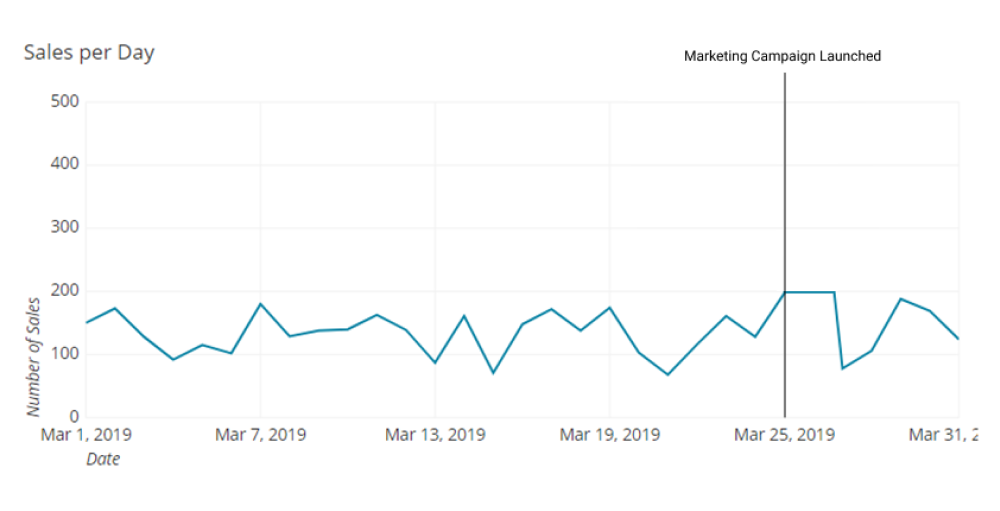
No Spike
Another point of interest are numbers that are not changing even though changes have been made. If you launched a new marketing campaign and the numbers are not going up, that could be due to a bug or poor campaign performance. They should be investigated in that order. Often the tracking was not set up correctly or the link in the advertisement was going to the wrong place.
Conflicting numbers
Sometimes metrics can be showing conflicting numbers even though they are measuring the same thing. If you see the number of new trials in HubSpot and your production database are different, the rule of thumb is to trust the data source closest to the event that is being tracked. In this case, it would be production.
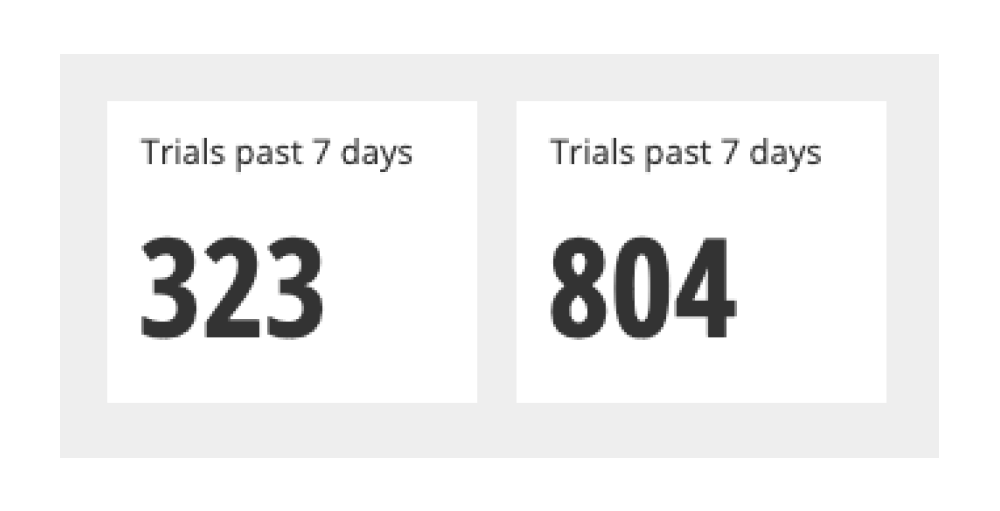
SELECT COUNT *
FROM USER
WHERE Trial_Start > NOW()::date - 7
	AND Email != “%chartio.com”
vs.
SELECT COUNT *
FROM USER
WHERE Trial_Start > NOW()::date - 7
Oftentimes people’s calculation of a metric will differ because of the following reasons: They are calculating it based on a different formula, the data source they are using is different, the data is being filtered differently, or there is an error in their calculation.
Common data errors
- New field or value not cleaned (nulls, encoded, wrong format, etc.)
- No new data
- All queries on a data source erroring out
- Performance
New field or value not cleaned
You will likely notice when there is a new column in one of your views that is not very clear. You should raise this to the Data Governor so that they can apply the necessary cleaning to it at the Data Warehouse stage. Avoid doing additional cleaning at the Mart level because others may need this field as well. Having a single version of it helps to make sure analyses are consistent.
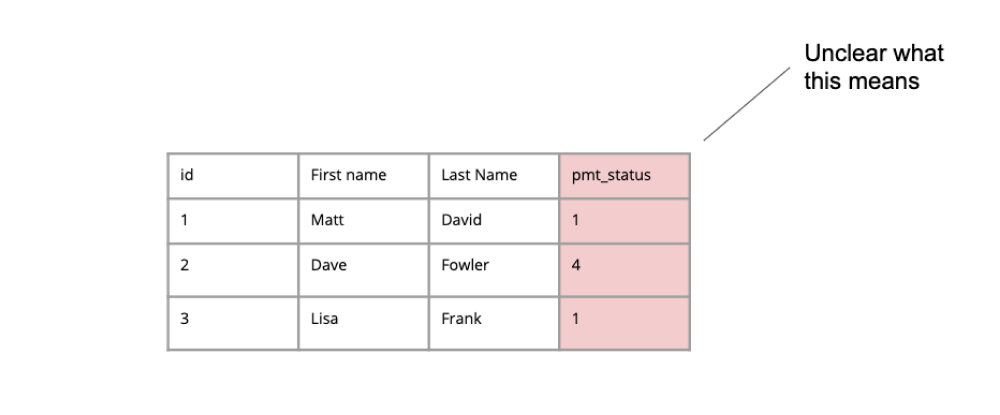
This can also happen when a new option is added to a field and it is encoded in an unreadable way. Follow the same process to get it updated at the Data Warehouse level.
No new data
If your query stops producing data after a specific date, you will need to investigate. This can be caused by a bug, a field being renamed, or the data source changing. This is more common than you would think. For instance, if you update a URL the data associated with the previous name will cut off. You can work around this within your SQL query.
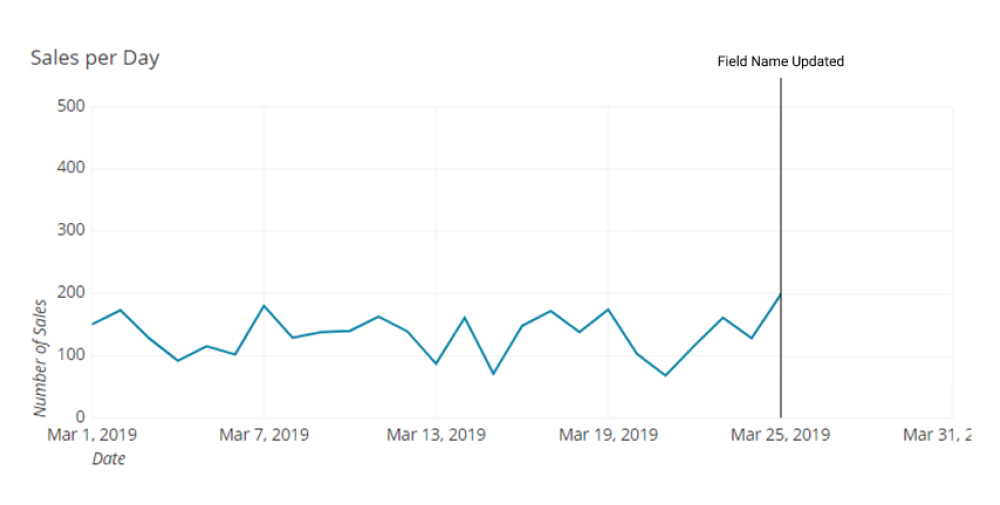
For example, when Chartio moved its URL from Chart.io to Chartio.com we needed to use:
SELECT
CASE WHEN page_tracking.url LIKE 'www.chart.io'
	THEN 'www.chartio.com'
    ELSE page_tracking.url
    END AS “Page”,
to_char(page_tracking.viewed_at_date, ‘YYYY-MM’) AS “Month”,
COUNT(distinct page_tracking.view_id) as “Views”
FROM page_tracking
GROUP BY 1
ORDER BY 2 ASC
You can also implement this as a more permanent fix at the Data Warehouse stage. One note of warning here is that sometimes you want to preserve this cut off to remember the name was changed, so think through the implications before making this modeling decision. If you aren’t sure why the data cut off, consult the Data Governor or your engineers to find out what is going on.
All queries on a data source are erroring out
This happens for a few reasons: the source has been deprecated, the source had an update changing its data structure, or a bug. This is something to communicate out to your team quickly as it can prevent a ton of data from being used.
Performance
If queries by you or your team start to take over a minute to run, you should investigate. Can the queries be optimized? Do we need to spin up more clusters? Or, do we need to do some pre-aggregation?
These are all fairly advanced solutions. To learn how to optimize the SQL, read our book titled SQL Optimization. To spin up more clusters you will need to consult with your engineering team and the Data Governor. To do pre-aggregation you should consult with the Data Governor and create a new view at the Data Warehouse level so others can use this newly formed view.
Identify new needs
Data is never a static thing. As new features roll out, new tools get used, objectives are set, and new data needs will emerge for your team. Do not assume that your mart will be updated when any of these changes happen. You need to proactively advocate to make sure your mart is updated in a timely manner.
Written by:
Matt David
Reviewed by:
Dave Fowler
