Increase Ecommerce Sales with Metrics
Last modified: July 26, 2019 • Reading Time: 6 minutes
Community Story

Adjunct Professor at Columbia University
I chose this story because I've encountered many examples where some metrics stayed because they have always been used, they are reported up to the "street" and as business changes they might not tell the whole story. A change in business may some time mean a change in how performance is measured.
Please reach out to me, @Allen Hillery, on our slack to discuss the article.
The problem with a single metric
I worked with an e-commerce client who was looking to get a grasp of his site’s conversion rate so he can find ways to increase it. The sporting good site had a 25% conversion rate and he wanted to develop a strategy on how to raise it to between 28% to 30% by the end of year. My client was fairly new to e-commerce, he had a successful career in retail sales and now he assumed responsibility for digital sales for his organization.
There are different nuances between shopping online versus in-store that he needed to learn. For example, customers interact with sales people when in the store. They’re able to ask questions and see and touch the product live versus browsing online. If the sales person sees that the customer is about to buy a product, they will throw in a discount to close the deal. When a customer is shopping online we only get to see metrics and data about their behavior which is harder to interpret and intervene.
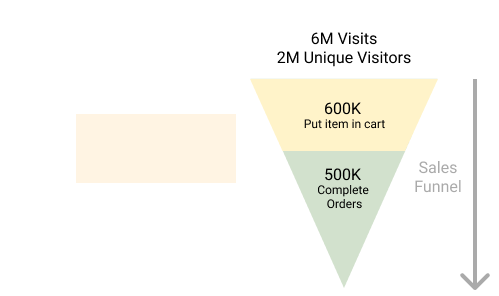
During our first meeting we reviewed the reports given from the marketing department. The marketing report showed 6M visits to the e-commerce site on average per month for the past two quarters. He wanted to know why with so many visits there were so few sales. In retail he could rely on that single metric to explain and predict sales. Fewer people in the stores fewer sales. And 6 million visits to the physical store would have meant a lot more sales than what he is seeing online
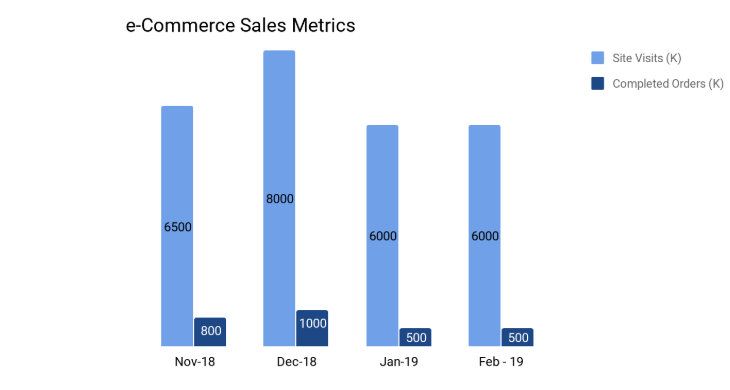
At 500K completed orders per month the e-commerce site, online sales were making up 20% of total orders. Seeing the total visits broken out by month was not helping my client see a way to increase conversion. He needed multiple metrics to help understand how to influence increased online sales conversions.
Use Multiple Metrics
We need to explore more metrics to figure out what is going on here.
- Is visits the right metric?
- What other metrics would help contextualize it better?
I met with the analytics director to get a better understanding of how data was being tracked. She explained that the marketing team is tasked with “bringing customers to the top of the funnel”. My client is measured on sales. Visits alone is not enough to help him develop a sales strategy.
The analytics director gave me insight into more metrics:
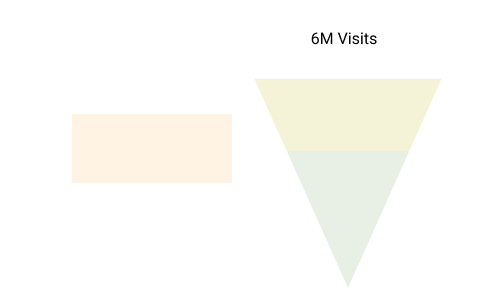
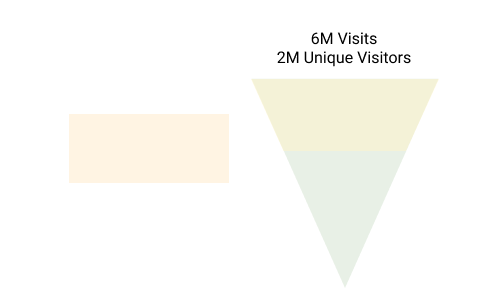
- Unique visitors - 2M on average per month for the 1st half of 2019
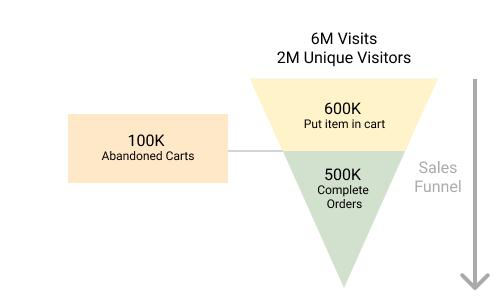
- Abandoned shopping carts - 100K on average per month with values of $100 or greater
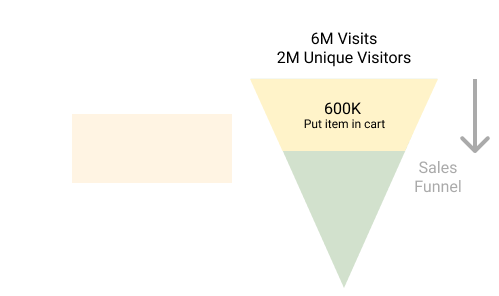
- Number of orders entering sales flow - 600K on average per month
- Completed orders - 500K on average per month
When I regrouped with my client, I used brick and mortar analogies to walk him through high level customer flows.
Visits
I explained that marketing uses this metric to measure how many customers they are bringing to the “store”. This equates to 6M visits on average per month coming to the e-commerce site’s homepage.
Unique Visitors
While the site has 6M visits a month only 2M represent unique visitors. We have 2M individual customers on average per month coming to the e-commerce homepage. So a customer can make multiple visits but they are one customer coming to the “store”. When we divide visits by unique visitors, we get 6/2 = 3 visits/unique visitors on average per month. So the average online customer is making 3 visits to the site per month.
Orders Entering Sales Flow
This metric represents the number of customers that have filled up their shopping cart and ready to check out. Understanding the sales flow can be very important in analyzing online sales. My client wants to make sure that online customers have the most optimal experience and nothing is hindering or obstructing the sales process. Currently there are 600K orders per month on average coming to the checkout flow.
Completed Orders
This metric lets us know how many customers made purchases on the e-commerce site. This is the most important metric for the sales VP as it gives him the bottomline number on performance. On average, 500K orders are being completed per month. One item to explore with my client is why there are 600K - 500K = 100K orders falling out of the sales flow.
Abandoned Carts
Another metric that can help with sales strategy is abandoned carts. When talking with the analytics director, we agreed that there are customers who are “window shopping” and/or doing price comparisons against other competitors. However when a customer leaves $100 or greater worth of product, we might want to reach out to them via an email or retargeted online ad.This way we are reaching out to the customer to see if there is still interest in a particular product they were interested in and inform them on a possible sale.
Currently there are 100K abandoned cart orders of $100 or greater on average per month. I will discuss with my client how to work with marketing to see if we can do a targeted campaign to these customers.
Interpret Multiple Metrics
My client now had multiple metrics to help him brainstorm a sales strategy. With 500K orders in monthly sales we know how many orders are being processes. With the average order being $1000 we can estimate that the site is generating 500K x $1000 = $5M in sales. So there are two clear ways to increase sales, completed orders and average order value.If either is increased, sales can increase. Let’s focus on completed orders.
We can optimize the top of the funnel which would be visits and unique visitors or we can focus on the bottom of the funnel which would be cart conversion.
Bottom of the funnel
We have 100K abandoned cart orders per month on average. I discussed with my client the possibility of working with marketing to target customers who have abandoned carts with orders of $100 or more.
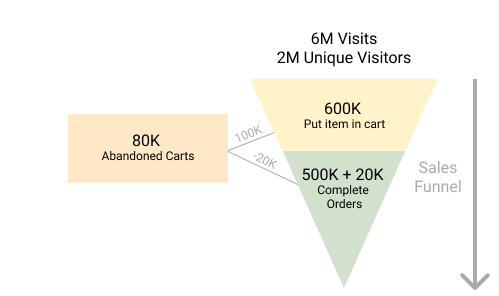
The idea here is that with this segment, there are a good amount of customers who might convert when given an email reminder and/or incentive. They are low hanging fruit in our goal to increase potential sales. Assuming we captured 20% of the abandoned cart segment, that’s 20% of 100K = 20K additional converted customers. Given us a total of 520K completed orders on average per month.
Top of the funnel
There are 2M unique visitors (potential customers) that visit the e-commerce site each month. This equates to a customer conversion rate of 500K/2M = 25%. These two variables number of sales and number of unique visitors can be analyzed to speculate how many sales or customers are needed to increase conversion. We can use this ratio to predict sales more accurately as we can easily relate orders to an individual customer.
For example, if we sent out a series of email and ad campaigns, we might be able to attract an additional 1M unique visitors to the homepage. Based on our current ratio, we have 3 visits for every unique customer. Therefore 1M unique visitors would equate to 3M additional visits to the e-commerce site on average per month. We can leverage visits as customer touch points knowing we have on average 3 times per month to reach out to a customer.

While it was beneficial to understand how many visits come to the e-commerce site, this alone doesn’t give insight on the sales impact. Visits tell us the level of engagement a customer is having with the site not their likelihood to purchase.
Using a brick and mortar example, customer like visiting Macy’s Herald Square as it’s a must-see for tourists visiting NYC, a nice escape for others on their lunch break, and a place many people window shop. The total number of visits people make might not correlate to sales. We want to know how many of those people are unique visitors so we can spend time marketing to those likely to convert and not those who just want a photo or to browse. Total visits and unique visitors help tell a bigger story than alone.
Conclusion
To understand the overall sales flow and how my client could begin to impact the conversion rate, we had to look at various metrics. My client and I worked with marketing and analytics to understand what metrics in addition to visits is available to analyze sales performance. We sketched out a funnel to map out the customer journey and sales flow. Using multiple metrics we were able to identify areas that we could improve to drive up sales.
Using various metrics helps form a holistic story on what is going on with the e-commerce site from different perspectives like sales performance and engagement. Multiple metrics helped my client gain more insight, better communicate his needs, and set reasonable goals for sales.
Written by:
Allen Hillery
Reviewed by:
Matt David