Statistic vs Distribution
Last modified: December 19, 2019 • Reading Time: 5 minutes
.png)
The problem with a single statistic
Most metrics are reported as a single statistic: Average time on page, Number of Active Users, Customer Acquisition Cost. While high-level statistics can be informative, relying on them to accurately represent the underlying data can be problematic because they can hide important patterns in the underlying data.

The amount of time on page above seems respectable! Let’s look at the actual underlying distribution of data points.
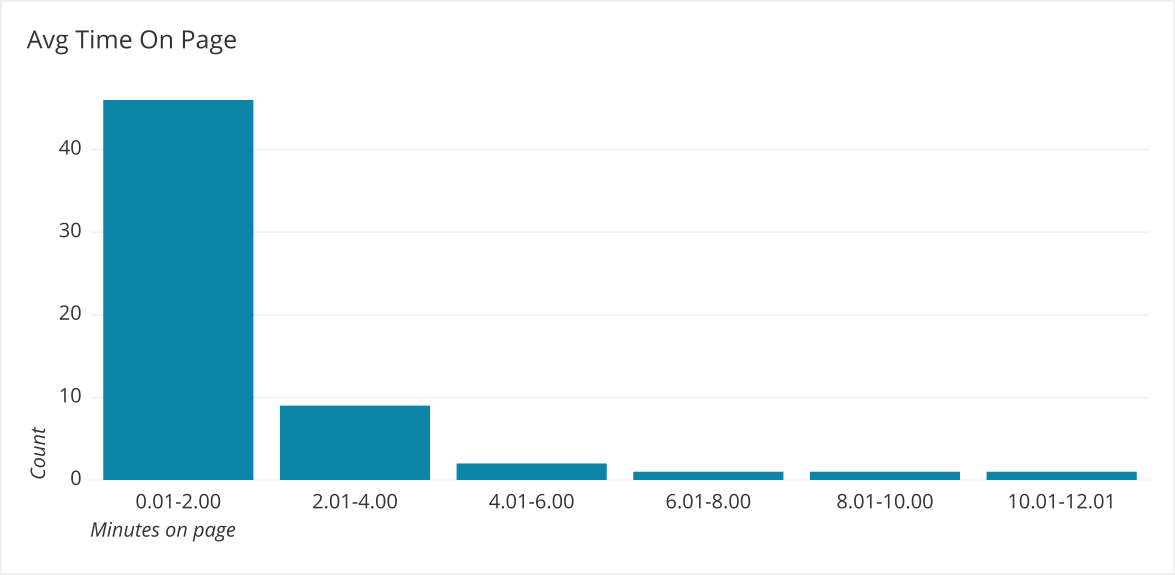
Here we can see most people are on the page for under 2 minutes, and we have some outliers that are affecting the average time on page. The statistic (Avg Time On Page) doesn’t represent the actual data well. On the other hand, if your data is fairly normally distributed, then the average will represent the underlying data well:
Distributions help you tell a much more nuanced story than a single metric.
Create a Distribution
While you can get a stat quickly with SQL with commands such as:
SELECT AVG("Time On Page")
FROM Traffic;
Creating a distribution is a bit more complex. First you have to create buckets for the data, which means you need to organize “evenly sized” ranges for your numeric data to fit into.
If you had the numbers {1,2,3,3,6,6}, you could bucket them into two groups: 1-3 and 4-6. The first bucket 1-3 would have 4 values in it {1,2,3,3} and the second bucket 4-6 would have two values in it {6,6}. You could also bucket them into three groups which would be 1-2, 3-4, and 5-6.
Bucketing can be done using CASE WHEN. Bucket sizes should be the same with the exception that the last bucket can have an open-ended upper limit if there are extreme outliers. Figuring out the correct bucket size to use takes some trial and error to capture the right amount of variation in the data.
Put the buckets into a Common Table Expression and then use a COUNT aggregation on your newly created column.
WITH 'Buckets' as (
  SELECT
    CASE WHEN "Time On Page" < 1 THEN '0.00-0.99'
    WHEN "Time On Page" < 2 THEN '1.00-1.99'
    WHEN "Time On Page" < 3 THEN '2.00-2.99'
    WHEN "Time On Page" < 4 THEN '3.00-3.99'
  END AS "Minutes on Page"
FROM data)

SELECT COUNT(*)
FROM Buckets
GROUP BY "Minutes on Page";
In many BI tools creating a histogram is a built-in type of chart that can take in any numeric field, bucket it, and then chart it appropriately.
Interpret a Distribution

Right Skewed - Since most of the data is lower than the average, using a median instead of an average would be more representative of the data because it falls more in the center of the actual data. This is because it is less affected by values in the tail.
Left Skewed - Since most of the data is higher than the average, using a median instead of an average would be more representative of the data because it falls more in the center of the actual data. This is because it is less affected by values in the tail.

Normal - Using an average or median here is acceptable because they both fall within the middle of the data.
Note: This is technically a unimodal symmetrical distribution, but often people will refer to distributions that looks like this as a normal distribution. To be a real normal distribution, it needs to have a very specific set of criteria that this distribution does not have.
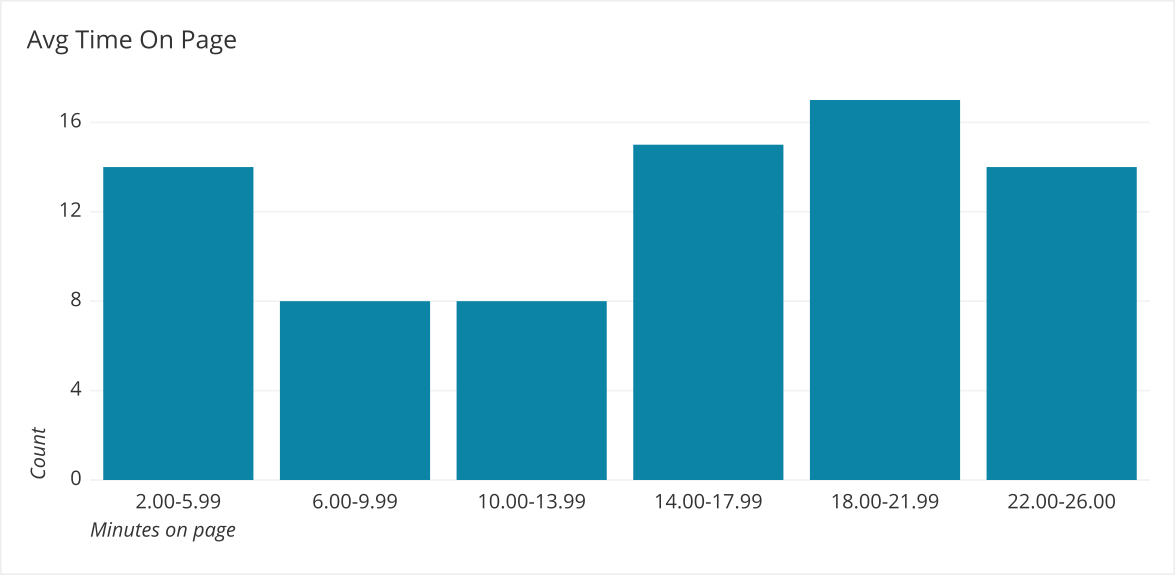
Bi-Modal - Neither an average or median is representative because there is more than one peak in the data. Split the data between the peaks and then report a summary stat on each section of the data.
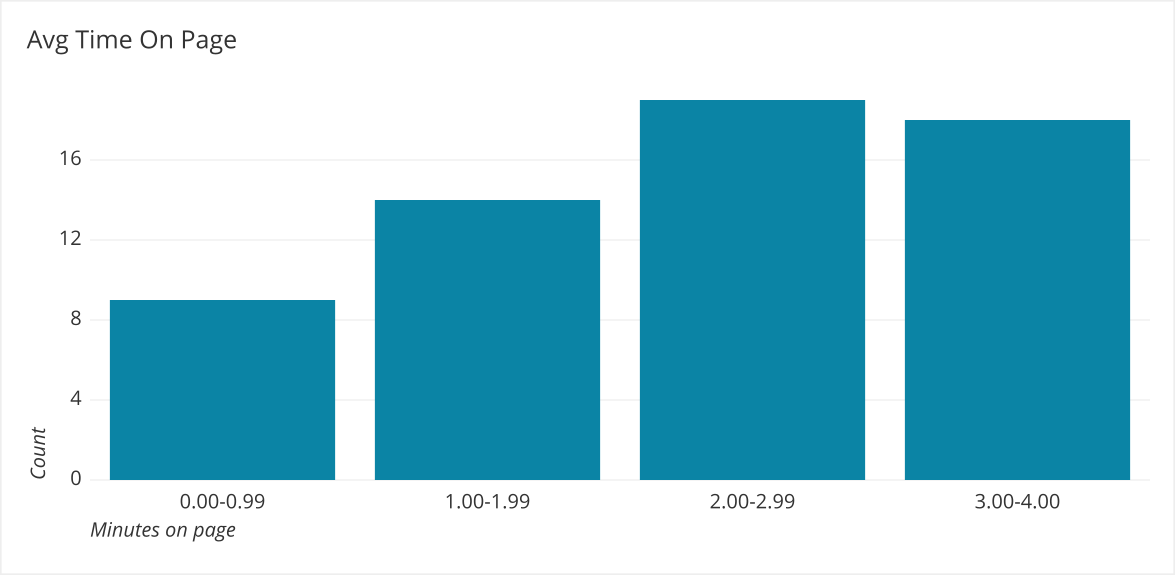
We can look closer at the peak on the lower end by making the bucket size smaller and filtering the data to be less than 10 minutes on the page.
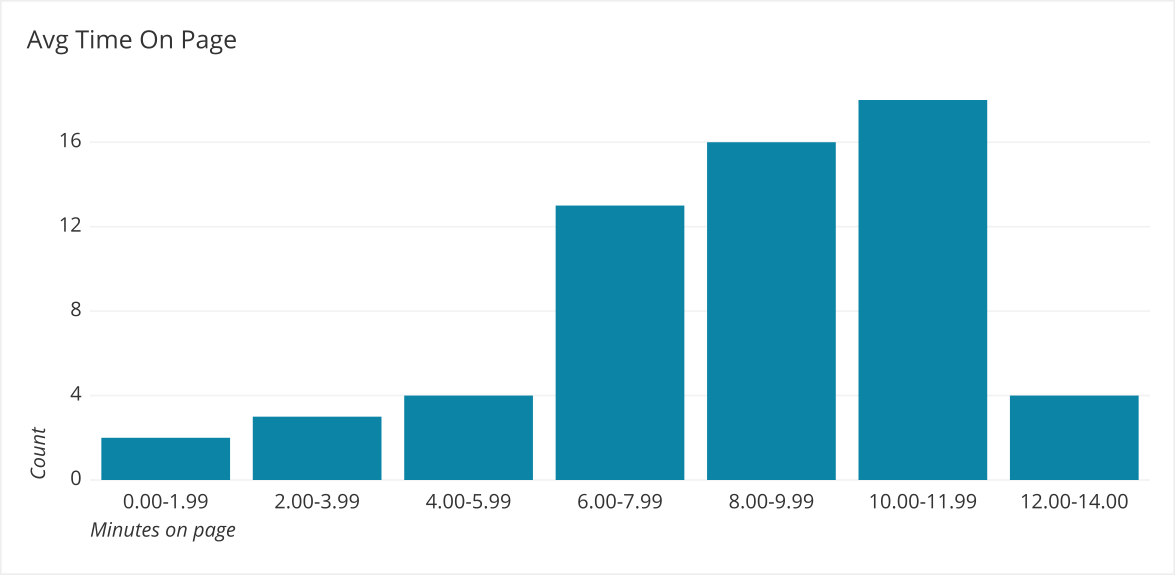
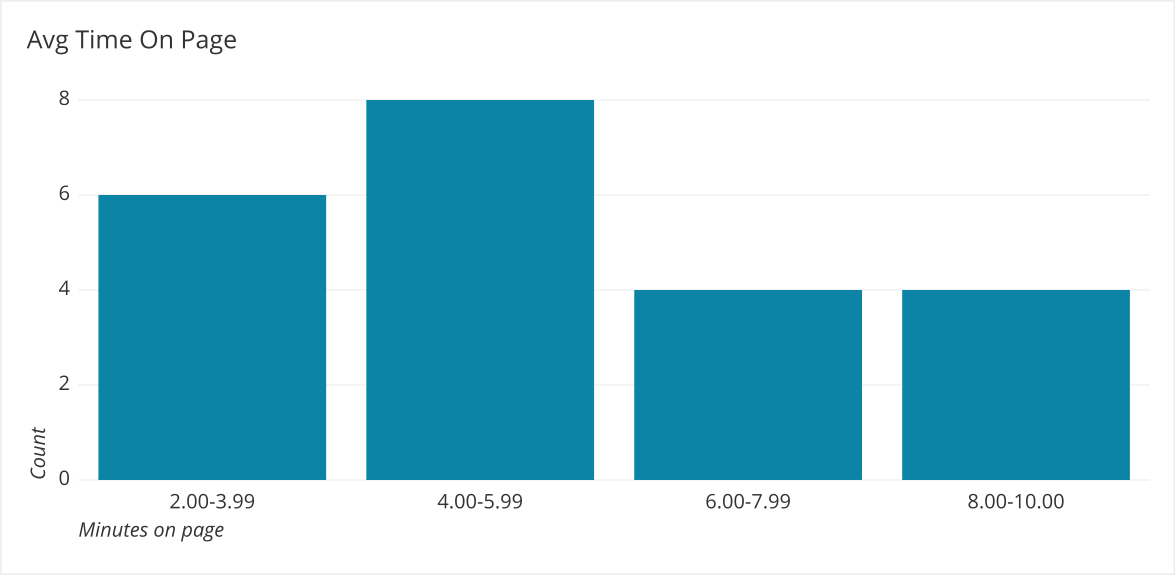 It looks to be normally distributed, now we can look at the higher end peak by making the bucket size smaller and filtering the data to be greater than 10 minutes.
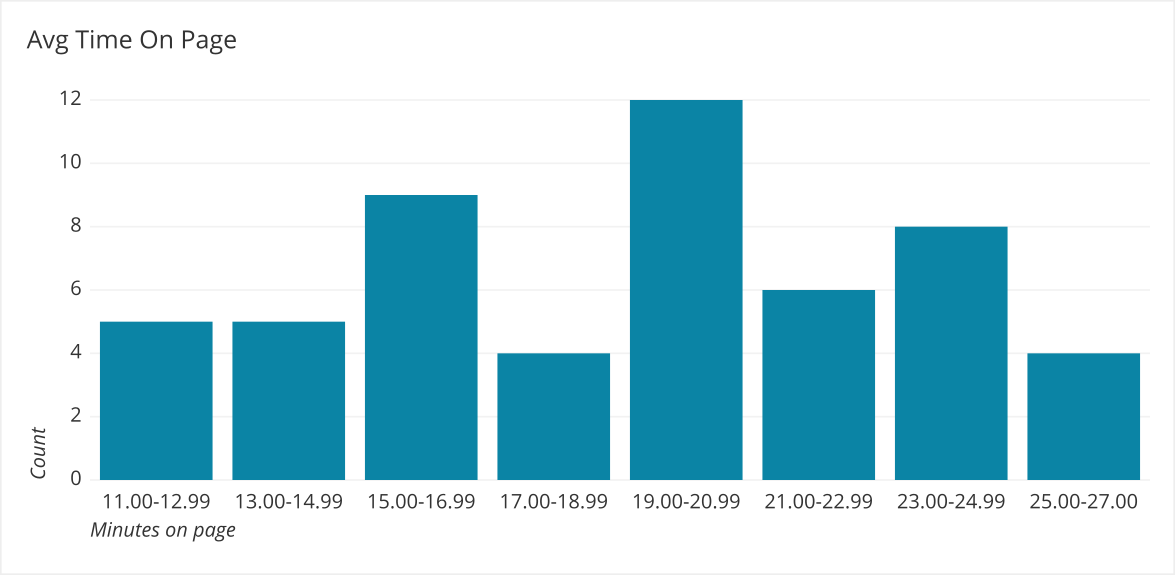
By splitting and re-bucketing we can see in greater detail what the underlying data looks like and which statistics would be a better representation of the actual data.
Summary
While statistics such as a mean or median are commonly used and easy to understand, a distribution adds more nuance and clarity to the data. Even if you do not end up displaying your distribution, you should look at it to know how well your summary statistic represents it.
- Always look at the distribution of the underlying data.
- Verify that the high level statistic accurately represent the underlying data.
- There are many types of distributions:
- Right Skewed
- Left Skewed
- Normal
- Bi-Modal
- And more
Written by:
Matt David
Reviewed by:
Twange Kasoma
,
Blake Barnhill
,
Matthew Layne