Build the Metrics
Last modified: February 15, 2020

In the previous chapters, we filled out the Metric Spreadsheet. We worked with the Point Person to define a list of metrics. Then we reached out to the Data Gatekeeper to determine what data sources we need. We will now use the completed Metric Spreadsheet to create various SQL queries.
The columns of the Metric Spreadsheet map to a SQL query.
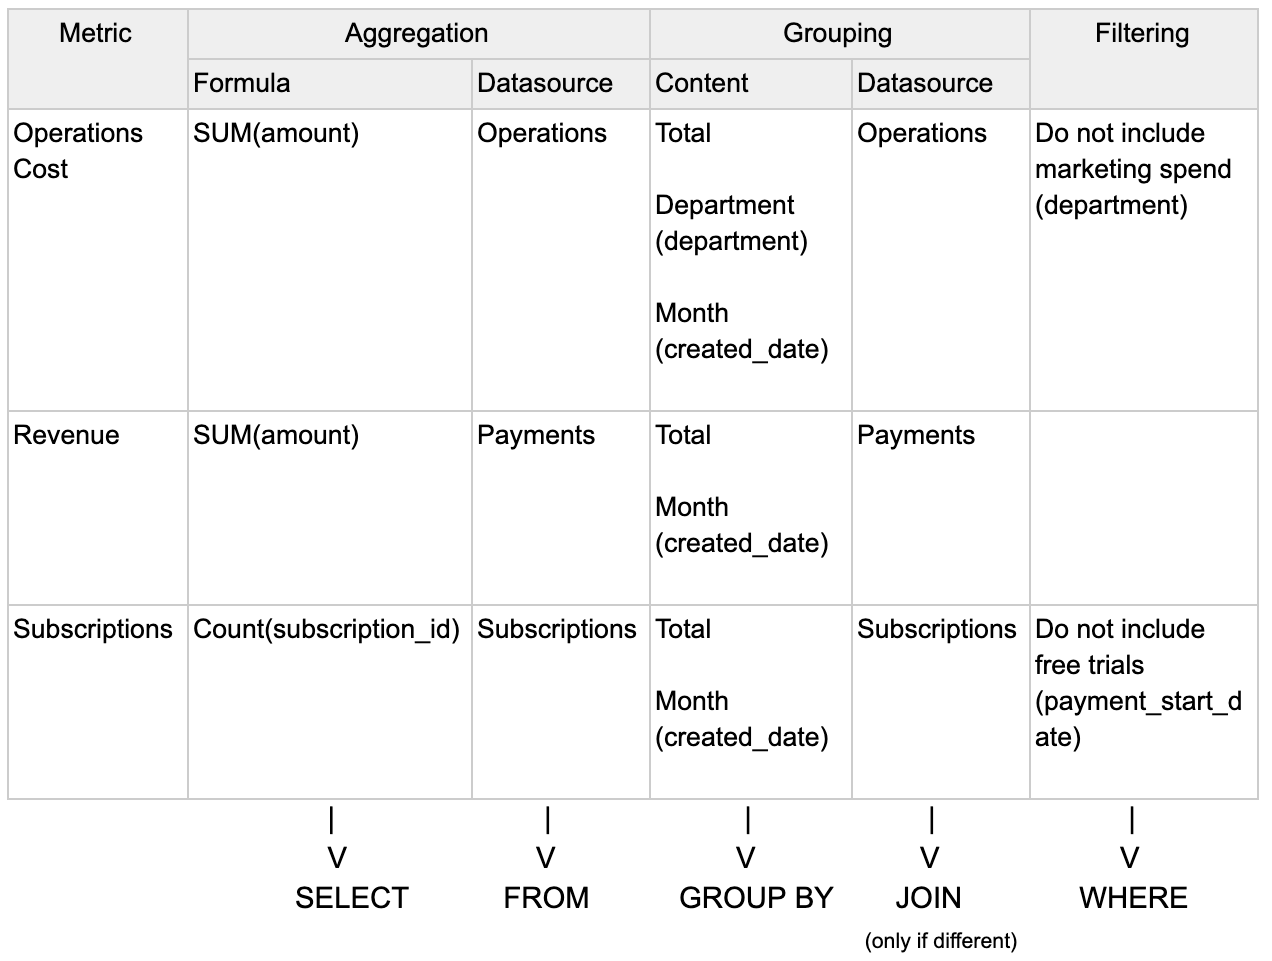
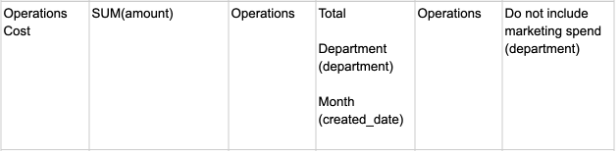
Take a look at a couple of sample queries we could create from this spreadsheet for the Operations Cost metric:
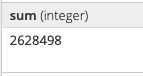
Total Operations Cost
SELECT SUM(amount)
FROM Operations
WHERE department != 'marketing'
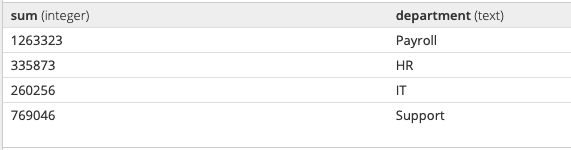
Total Operations Cost by Department
(When we introduce a GROUP BY statement we must include any column there in the SELECT statement as well)
SELECT SUM(amount), department
FROM Operations
WHERE department != 'marketing'
GROUP BY department
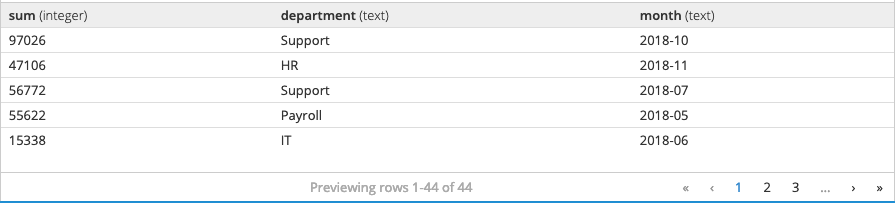
Total Operations Cost by Department by Month
SELECT SUM(amount), department, TO_CHAR(created_date, 'YYYY-MM') AS month
FROM Operations
WHERE department != 'marketing'
GROUP BY department, month
One of the beauties of SQL is that it can do the logistical work of finding the columns in the data sources, and it can also compute mathematical equations. Most other methods require you to first access the unaggregated data via SQL and export the data into the tool so that you can create the calculations. Since SQL is tied to accessing the database when the underlying data changes, you can rerun the query and see the latest data. This is more efficient than exporting data into another tool.
SQL Resources
If you are struggling with understanding how Aggregations or Subqueries work check out:
If you are running into errors or are getting 0 rows returned check out:
Checking your Queries
Do not assume your query is perfect. You should check it by looking at other peoples’ queries and/or having the Data Gatekeeper review it.
Check other people’s Queries
Depending on the BI tool that you are using you can see other people’s SQL queries. This can be very insightful. You can take note of data sources they used that you were not aware of. You can also see if other people have complexity in their queries.
Complex Query example:
SELECT DATE_TRUNC('day', "Payments"."payment_date")::DATE AS "Day of Payment Date",
SUM("Payments"."amount") AS "MRR"
FROM "public"."payments" AS "Payments"
WHERE ("Payments"."payment_date"::DATE BETWEEN {CALENDAR_INTERVAL.START} AND {CALENDAR_INTERVAL.END})
GROUP BY DATE_TRUNC('day', "Payments"."payment_date")::DATE
ORDER BY "Day of Payment Date" ASC
LIMIT 1000;
Complexity in a query such as the one above typically suggests the data is nuanced, messy, or certain business logic needs to be adhered to. If you come across a complex query that is for the same or a similar metric as the one you are working on, try reaching out to the creator of the complex query. You should try to understand what the extra parts are all about so you can incorporate what is relevant into your own query.
On the other hand, if other people have similar looking queries for similar metrics you are probably in the clear. However, you still will want to get someone else’s eyes on it for verification.
Consult Data Gatekeeper
Get a code review on your queries. Reach back out to the Data Gatekeeper to validate your queries are calculating their metrics correctly. Having the metric spreadsheet facilitates this process since they can see your work and how you go to the query you wrote.
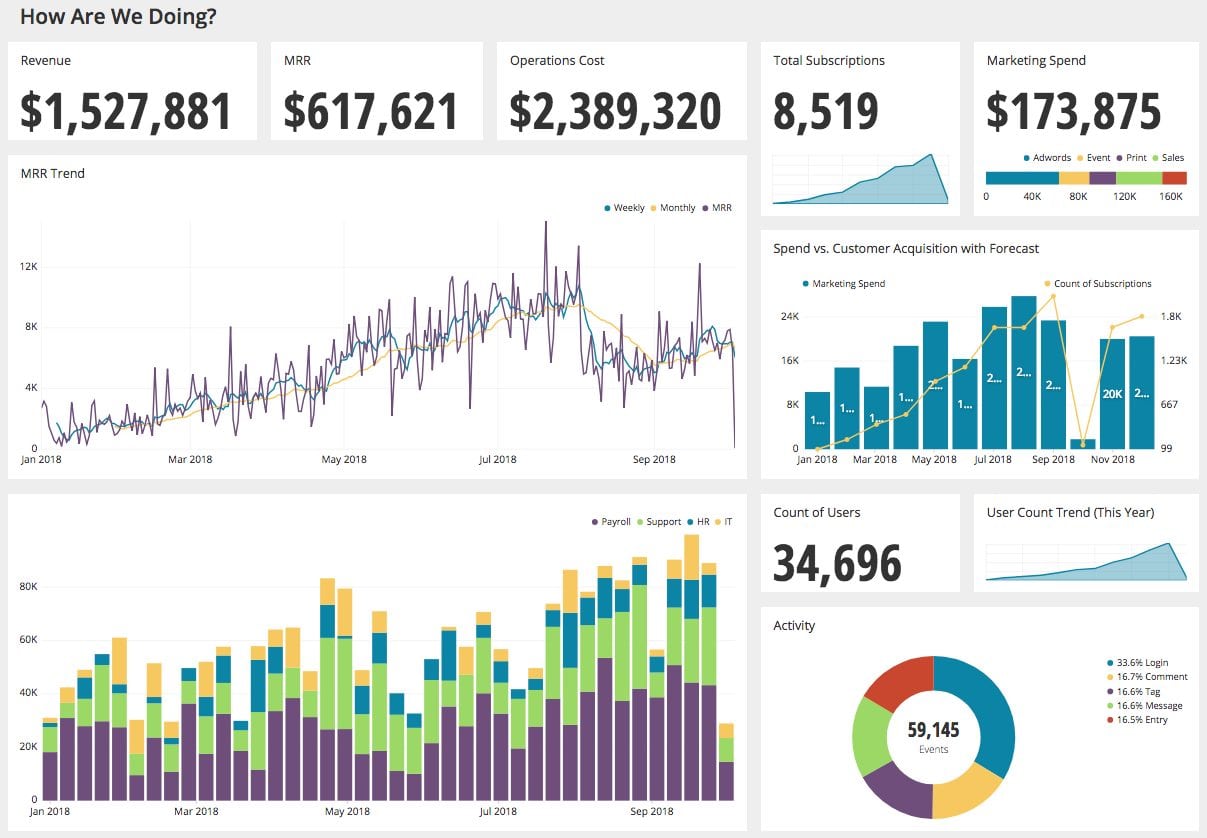
Build the Dashboard
Go through each table and create the corresponding queries and then take that data and build the visualizations on top of it in your BI tool. Arrange all the visualizations to match your final sketched dashboard. Once you are done you will have created a well designed dashboard.
However even with all the thought and effort put in so far there are still critical steps to make sure this good design becomes even better.
Summary
- Build metrics in SQL by plugging in the columns to their relevant part of a SQL statement.
- SQL is required to get the data. Use it to calculate the metrics directly as well as to reflect any underlying changes.
- Check your queries by evaluating other people’s queries in your company and/or having the Data Gatekeeper review it.
Written by:
Matt David
Reviewed by:
Mike Yi
,
Tim Miller
,
Dave Fowler