Sharing the Dashboard – Distribution Strategies
Last modified: February 15, 2020
Now that you’ve built your dashboard, you can begin to share it. Before you hit “send”, take a moment to consider how to optimize the impact:
- Context
- Medium
- Scheduling
Context
No matter how smart your audience is, you should design it to be readable by anyone in the company. Dashboards are shared across department lines, used in presentations, and help new employees learn about the business. In all of those situations the people viewing the dashboard have little context. The basic things you need to include to make each chart understandable by a wider audience are:
- Descriptive chart titles
- Label axes
- Provide a key
- Add Definitions
Descriptive Chart Titles
Titles of charts should let the audience know what is being shown or compared. Without a title it is unclear what they are looking at and it will take longer to process the chart’s information.
It’s clear that the chart is about monetary costs, but the axis label doesn’t specify the type of costs being measured. That information, of course, is the role of the title.
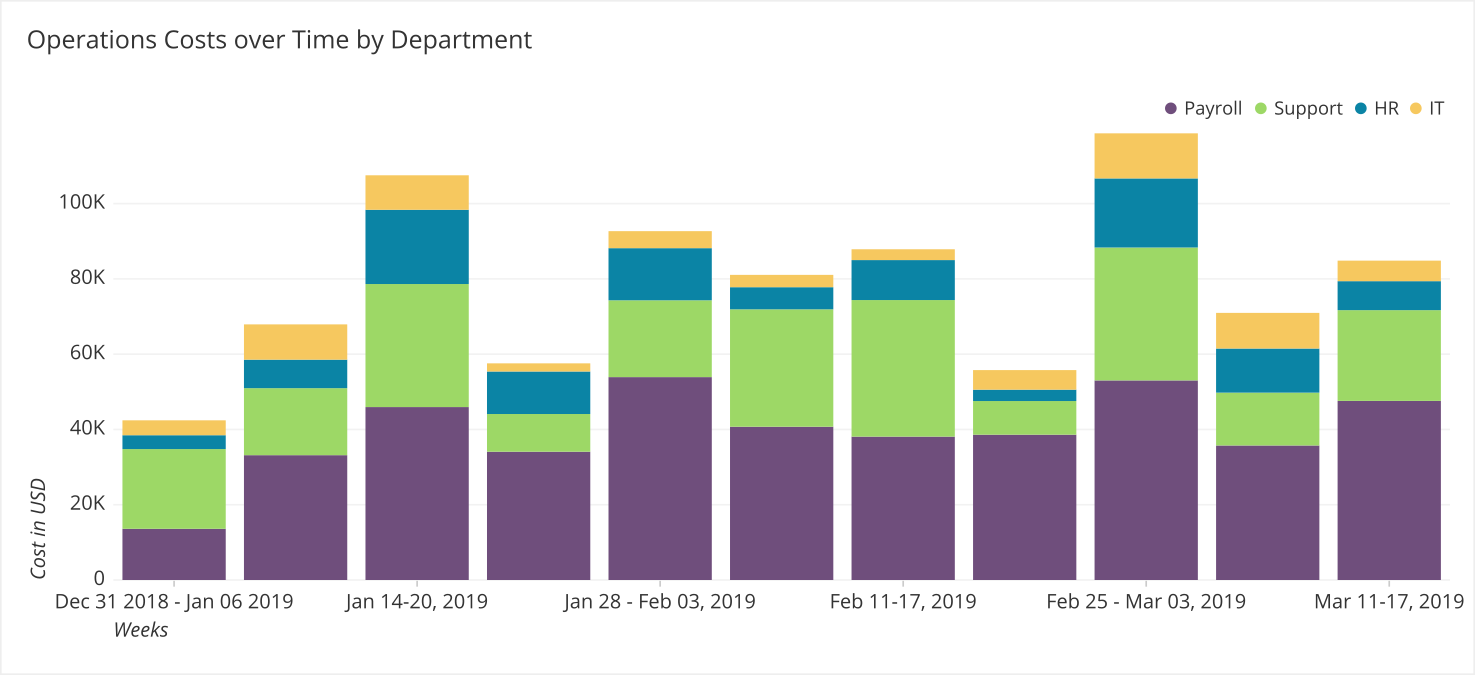
Once the title is added, the purpose of this graph is clear. We are evaluating the operations costs over time by department.
Label Axes
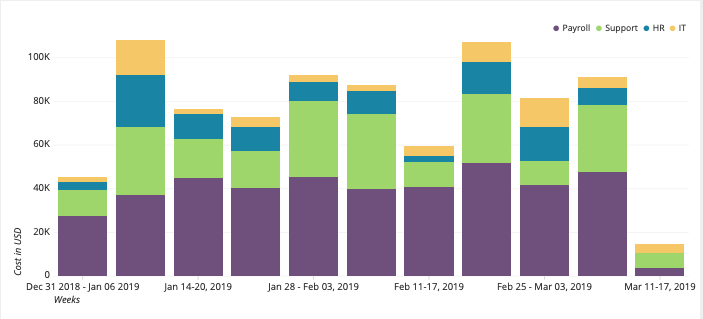
This is one of the most common pieces of context that is not included in a chart. Labels on axes should include a description and the unit for quantitative measures. If we look at the same graph as above without axes labels, we can see how it could become difficult to interpret.
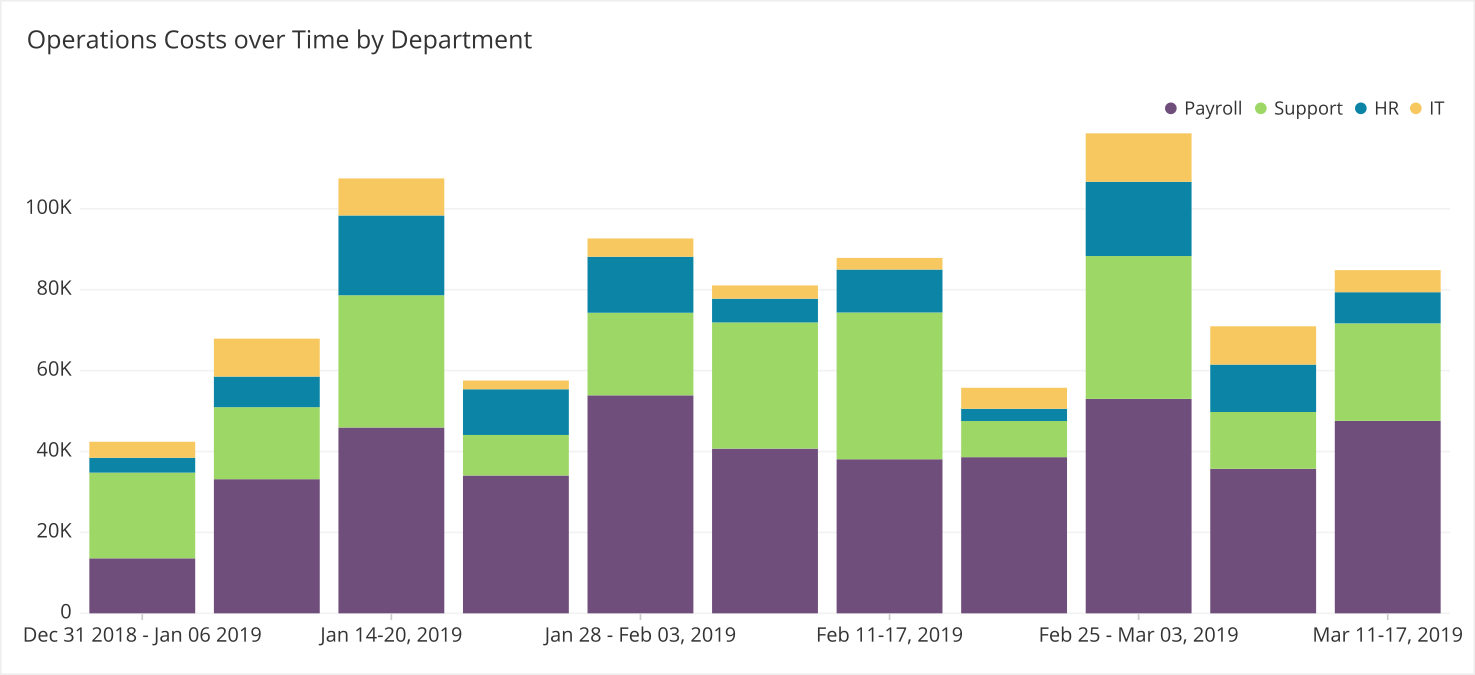
While the X-axis is fairly understandable given the labels, the Y-axis labels are a bit ambiguous. The title gives us a hint that we should be seeing costs but how are the costs measured? It could be different currencies, the number of employees, or the amount of hours worked.

Adding the Y-axis label makes it clear we are looking at costs in US dollars. While labeling axes can occasionally be left off, best practice is to include it first and then remove it based on feedback from the audience.
Provide a Key
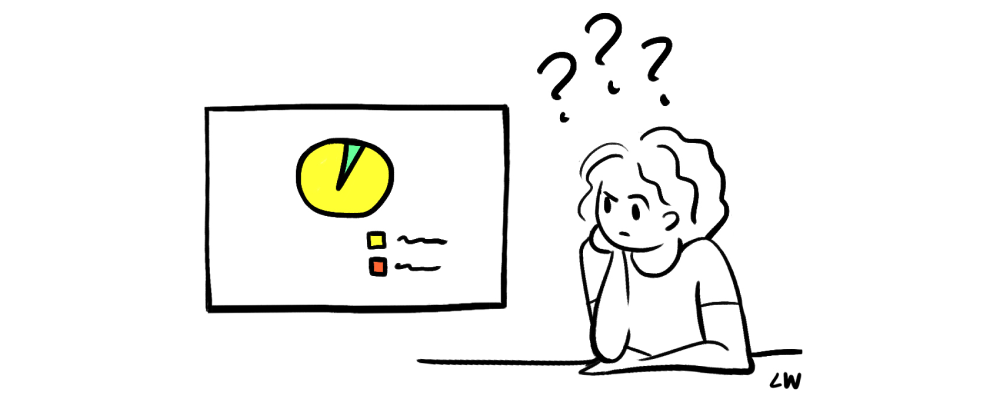
Anytime color is used to delineate groups or represent a range of values, a key or legend is necessary for determining what the colors represent. It is impossible to determine which bar belongs to which department without the key.
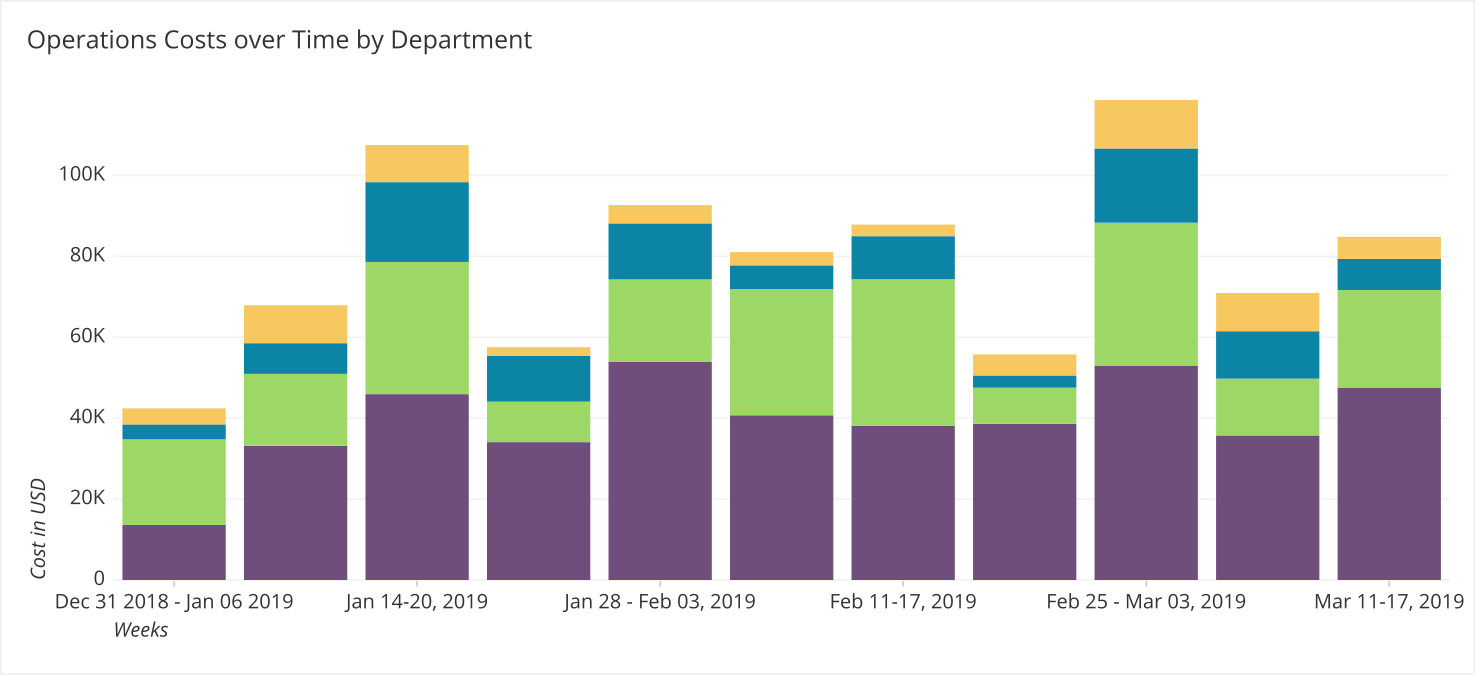
Whereas the version of this chart in the previous section is quite obvious that purple is payroll, green is support, blue is HR and yellow is IT.
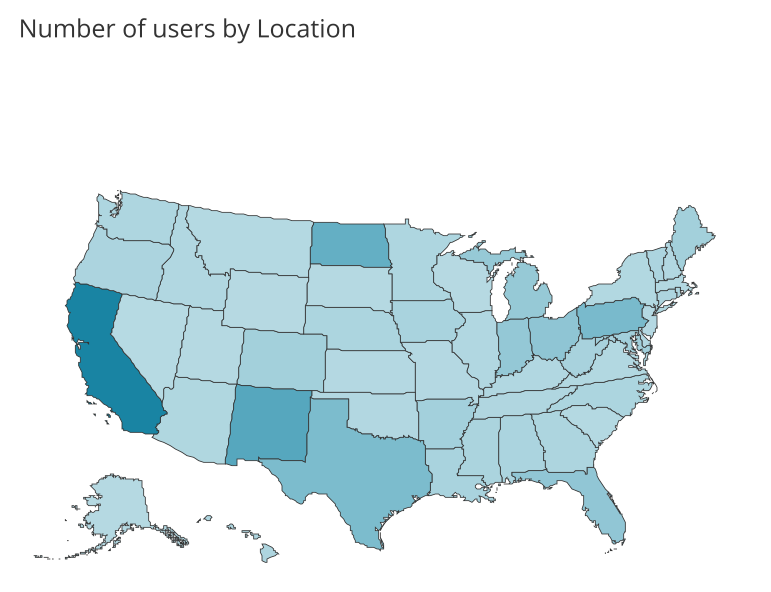
The lack of a color key is also very confusing when color is used to encode a quantitative range. As we can see in the chart below, we can infer that some states are different than others in terms of the number of users. And we can also assume darker tones mean more than lighter tones but we do not know how much more.
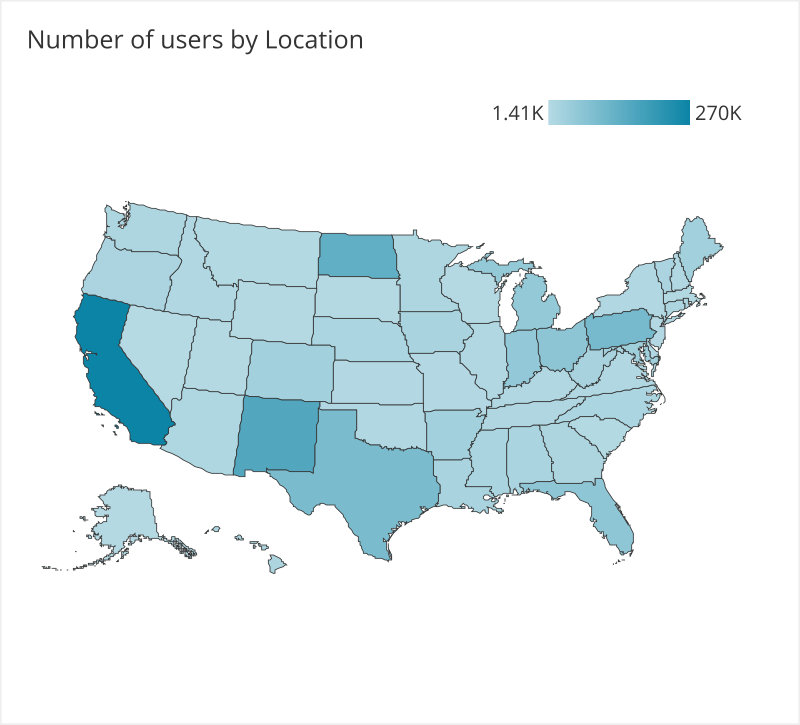
Once we add a key, the range of values becomes clear and the map is more useful for decision making.
Add Definitions
While some metrics are defined fairly consistently such as Net Promoter Score, some metrics such as MQL (Marketing Qualified Lead), DAU (Daily Active Users), and others are calculated very differently from company to company. The differences are typically due to excluding some groups from being factored into the metric. In such instances, providing notes directly on the dashboard or making them easily accessible from the dashboard is critical to interpreting the information accurately.
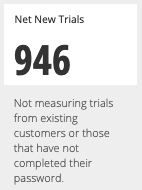
Adding a short description beneath the metric clarifies the information that is represented and its limitations. For commonly used metrics, it is also a best practice for the Data Gatekeeper to model this into the schema itself so it can be more easily queried. For more on Modeling check out another Data School book: Cloud Data Management.
Medium
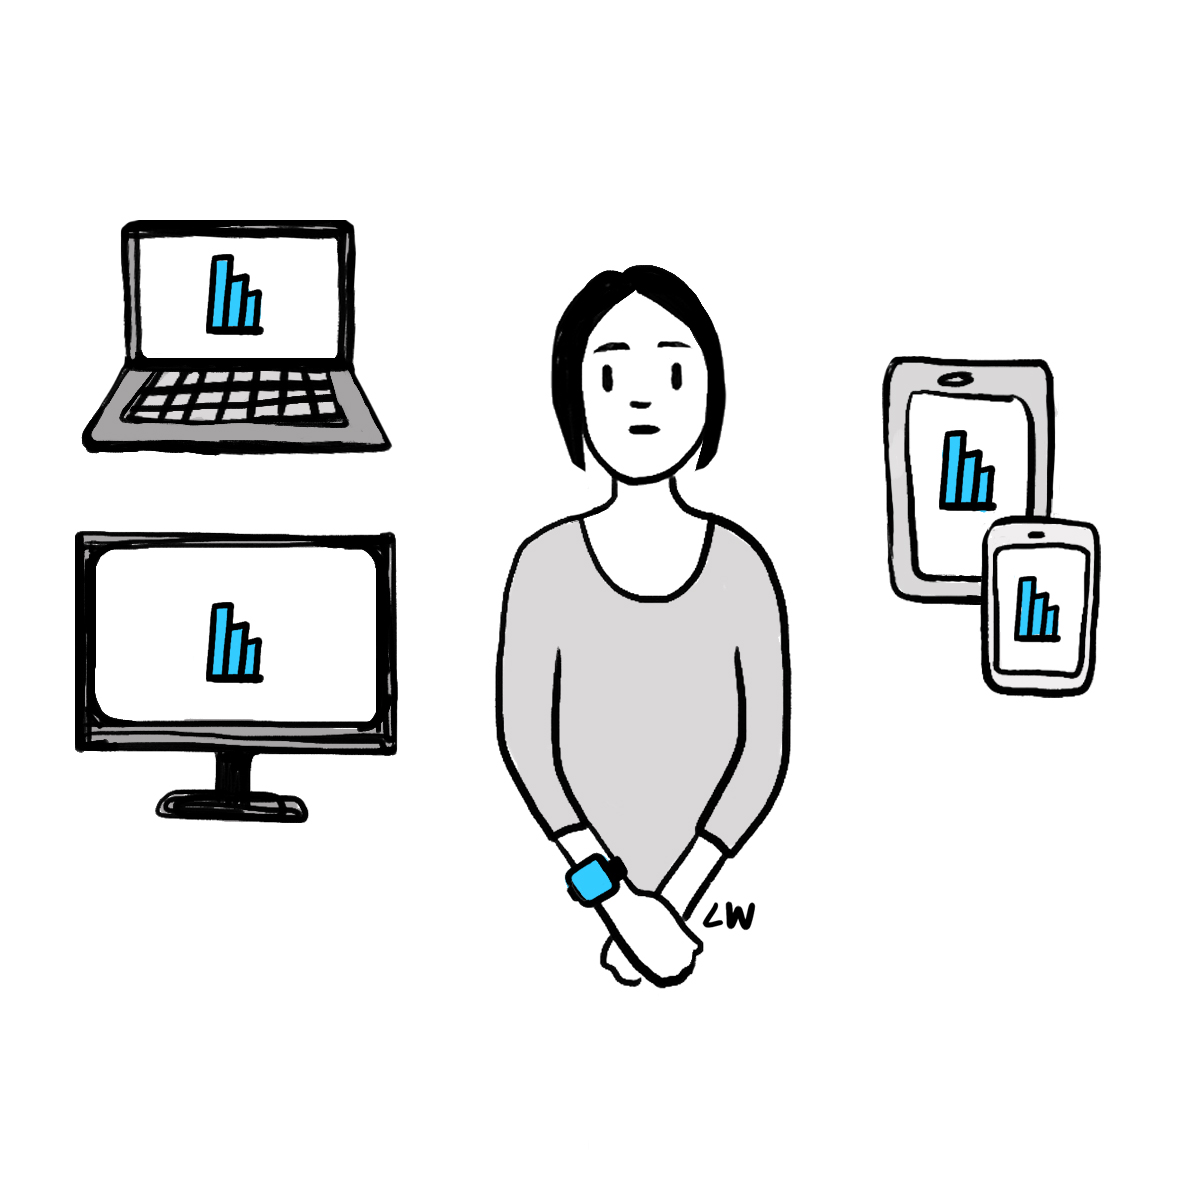
Emailing a dashboard is a straightforward way to share your work. However, there are a few common mistakes to avoid by asking yourself the following questions:
- Can this dashboard be shared externally? (typically not)
- What level of access do people need to view the dashboard? (typically they need more than you think)
- How frequently should I send out the data so that people don’t ignore it? (align the schedule with the frequency of decisions being made from the dashboard)
You should state whatever policies are relevant in the email that includes the dashboard link. You should also set a schedule for emailing out the dashboard that is appropriate to it’s goal.
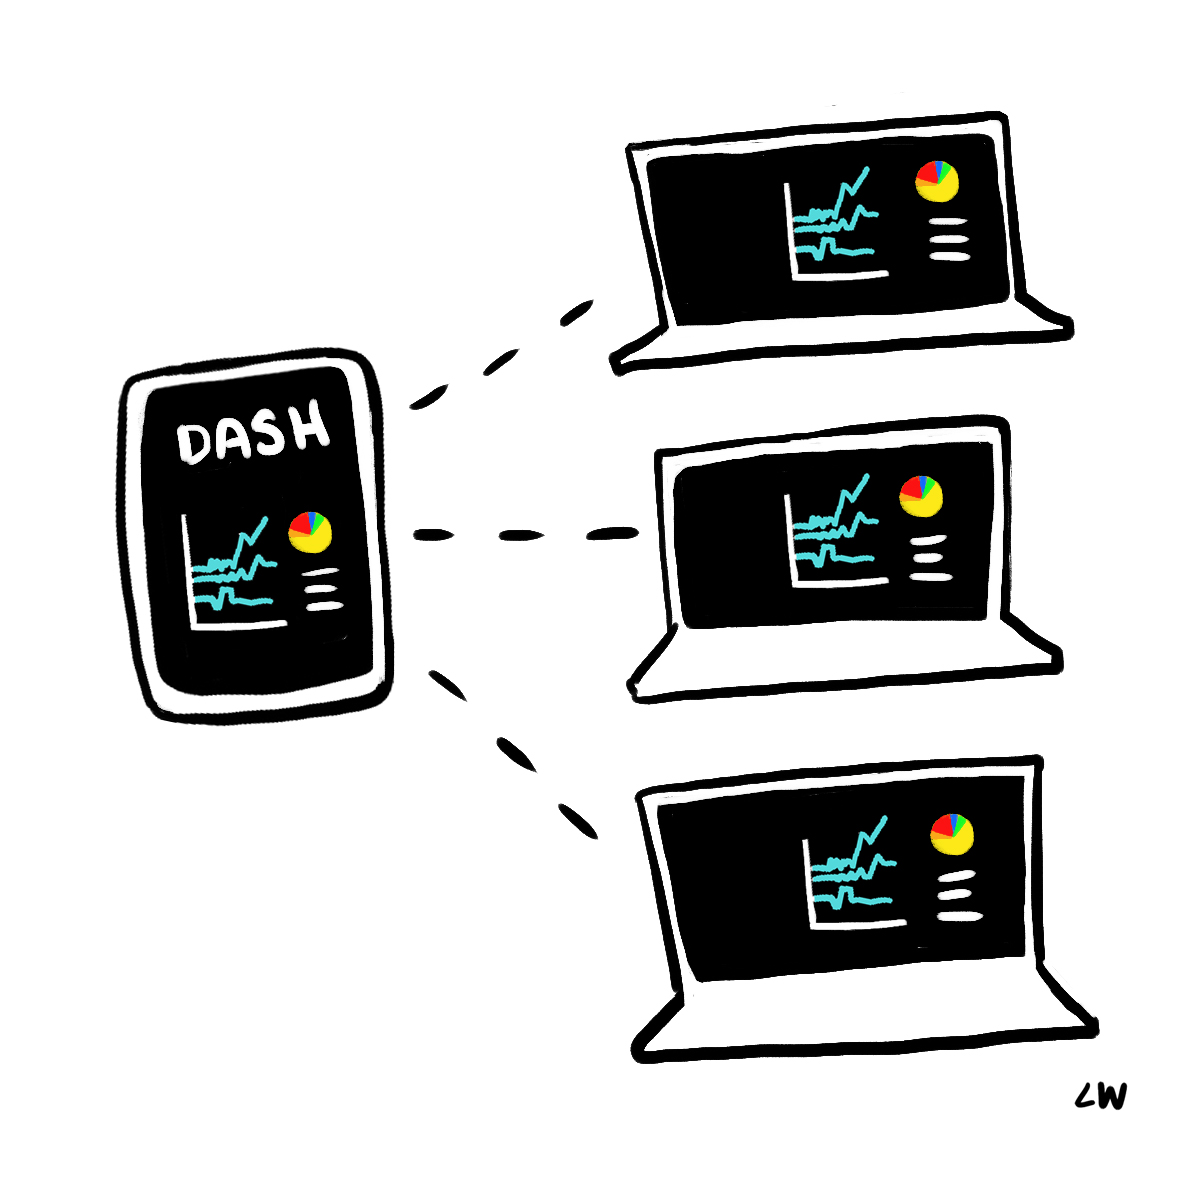
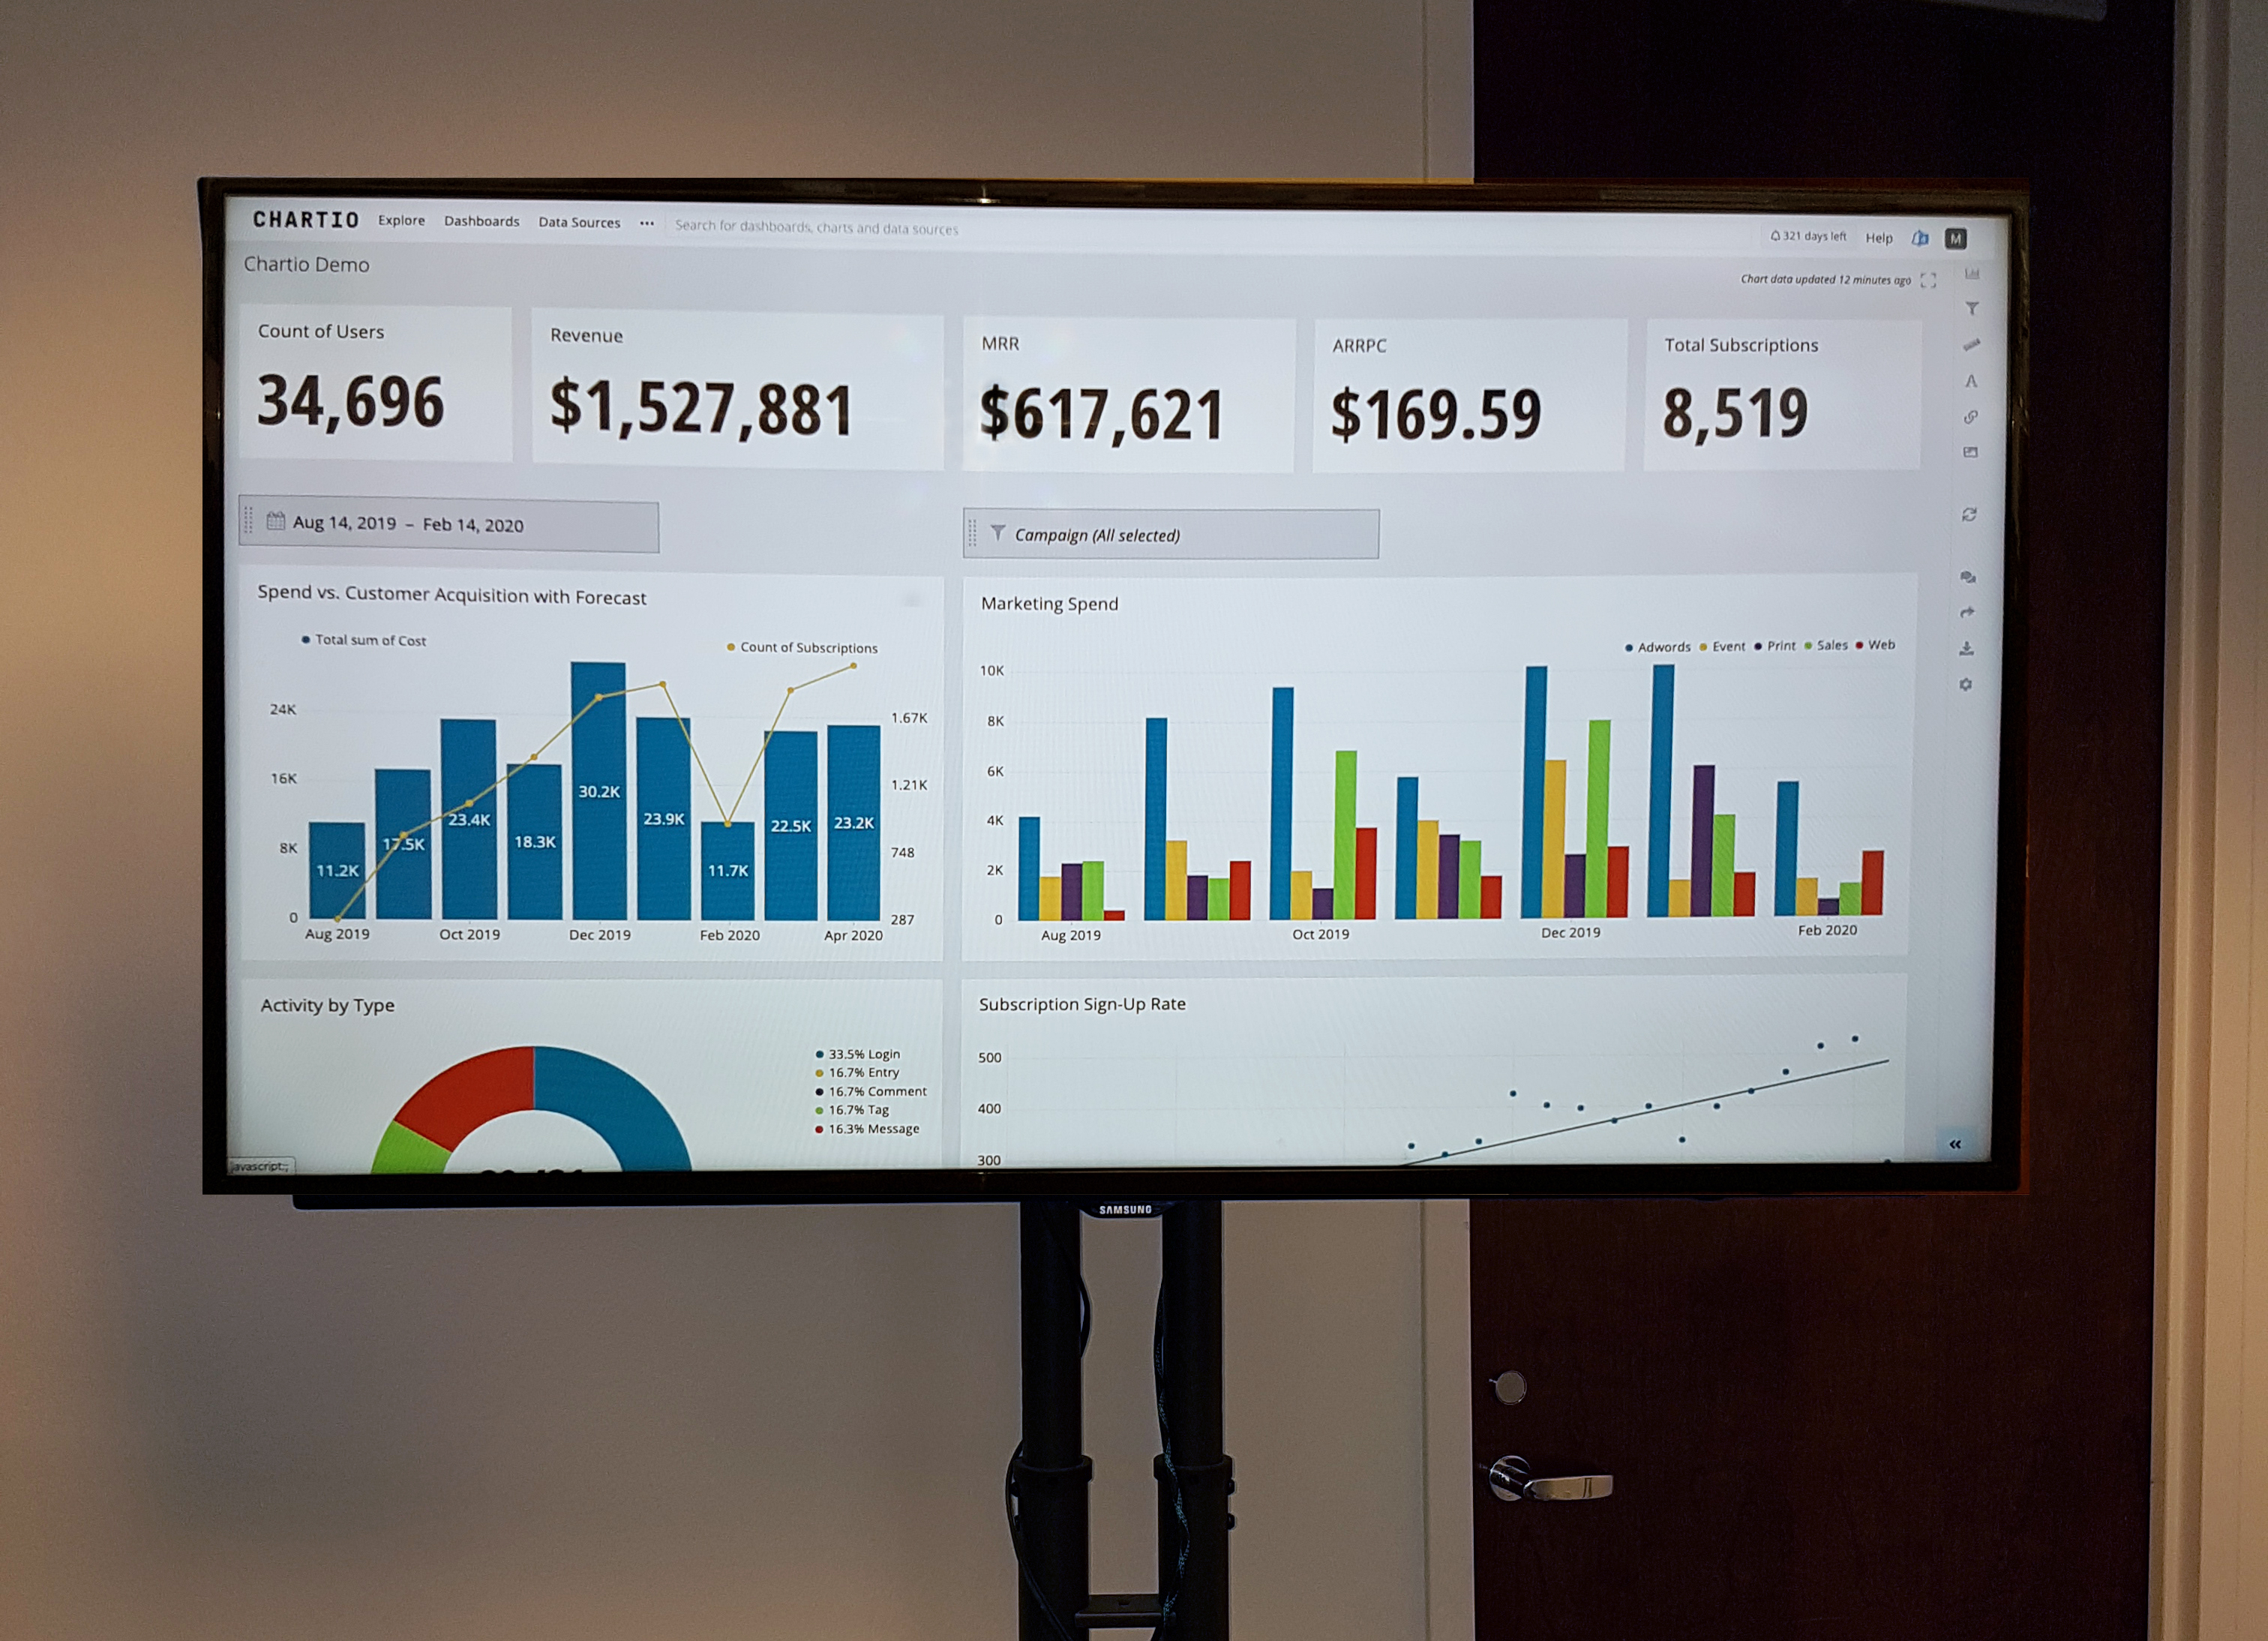
Television or monitor
Dashboards can be stylized and formatted to be displayed on televisions or other large monitors throughout an office. You can see the problem with needing to scroll here, as it isn’t an option. Sometimes dashboards are presented on multiple televisions mounted to the walls of bullpens, office spaces, conference rooms, and lunch/break rooms.
Since many different types of employees will be viewing data presented in this fashion, their opinions about how it should change could be very diverse. Collect all the feedback you can and then work with the Point Person to prioritize updates. Be prepared to make significant changes on these types of dashboards once they are released.
From a technical perspective, there are a few other concerns.
- You will want to know how the television connects to the network so you can determine how to get it on the TV in the first place.
- You may need a dedicated computer or a wireless connection through Google Chromecast, Apple TV or similar technology.
- You will want to know the television’s resolution, as this will determine if you need to make any adjustments to your dashboard design to be clear and readable.
Be prepared to test and troubleshoot these connections and displays before you officially put the dashboard on TVs.
URL from Application
Most software that helps you build a dashboard will also support sharing it via a URL. This software may be new to your audience. In which case, you will need to verify your audience has login credentials, some basic training, and access to the dashboard’s URL so that they can view the dashboard.
Many of these platforms provide the ability to set access permissions for every dashboard. Setting these permissions appropriately on a dashboard will prevent it from being accidentally deleted or edited by another employee. Best practice is to not give people edit access unless they request it or they are part of the data team.
Paper copy
Occasionally an executive wants to receive a printed out version of the dashboard. While this can be slightly frustrating to accommodate, make sure the dashboard is delivered in the following ways.
Timely
Do not miss the scheduled delivery time. Executives often have a lot of meetings every day and this information might be critical to them making the best decisions.
Securely
You may not know the sensitivity of the information on the dashboard. After you’ve printed the dashboard, put it in a folder and make sure the papers in the folder cannot be seen when the folder is closed.
Personal Delivery
At first, you will want to deliver the dashboard in person to keep up a necessary rapport for the feedback loop we will discuss later. Delivering it in person will always give you the opportunity to ask questions, even if the answer is short you will be able to gather some information on how the dashboard is fulfilling the executive’s needs.
Scheduling
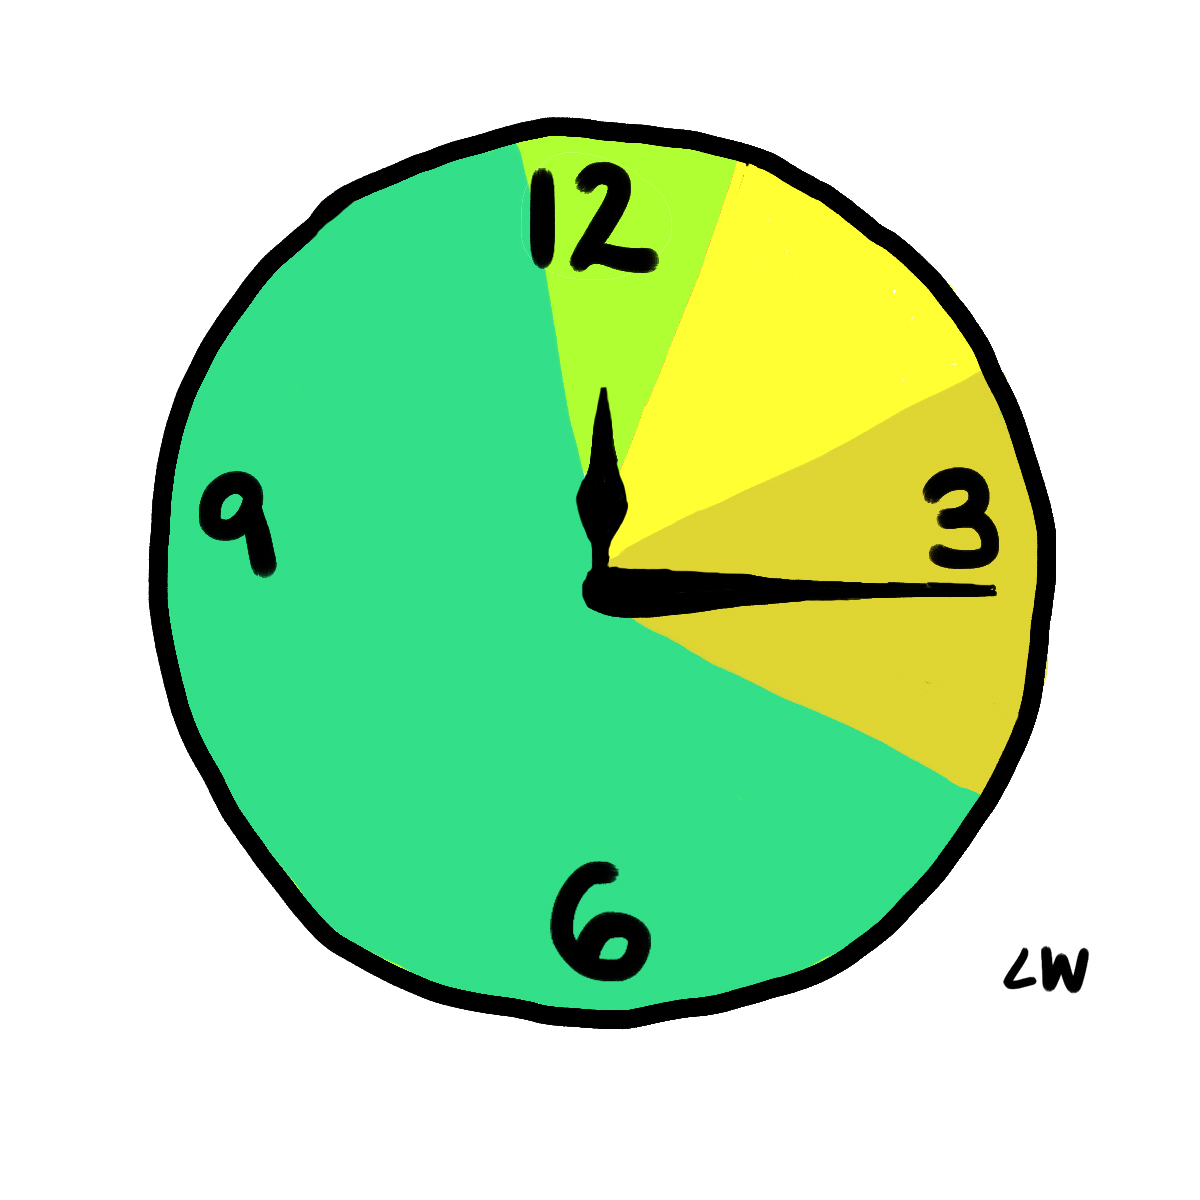
Scheduling should mimic the pace at which decisions need to be made. If the decisions that are made based on a dashboard are ad hoc then do not send out scheduled emails about the dashboard instead provide them links and let them check it whenever they need to. If people need to have context every morning of what is going on to start making decisions, then sending a daily email at 8:00am with the dashboard is appropriate.
Finally, if people do not need to view the dashboard to make a decision unless a metric changes dramatically, set up an alert. Most dashboarding software supports being able to set a level of change on a chart such that once it is crossed, an alert will go out to an email of your choosing. Be careful with setting alerts. If you choose an artificially low or high bar to trigger emails you may get way too many or way too few.
Sending people dashboards on a schedule that does not match their decision making needs could result in ignoring the dashboard and not using the data to support their decisions.
Summary
- Provide enough context for a dashboard so that your audience for clarity, accuracy and efficiency (can take it in with minimal questions)
- Choose a medium that aligns with the audience’s expectations
- Use scheduling to help people make decisions not to remind them the dashboard is available.
Written by:
Tim Miller
Reviewed by:
Mike Yi
,
Matt David
,
Dave Fowler