Finding the Data That Builds Metrics
Last modified: February 15, 2020

From the previous chapters, we established a foundation for building a dashboard, answering the questions of:
- What decisions will this dashboard support?
- What metrics will inform those decisions?
- Which visualizations best showcase those metrics?
However, the biggest challenge in dashboard design can be the “How”, as in how we get the data to build each of the visualizations.
The three data scenarios you will encounter finding the data are:
- You have clean data
- You have messy data (most common)
- You have no data
If you have the data this will be an easy step of the process. If the data is messy or it does not exist things will get much more challenging.
When you have the data

Finding where the data that you need is can be the hardest part of the process. Often, data is not well documented and what you need could be spread across multiple databases. First, search for tables that have keywords from your Metrics Spreadsheet.
Review the schemas of the databases you have access to. Some BI tools provide you with visual Entity Relationship Diagrams to help you explore:

Some products such as Chartio also allow you to search to find relevant columns and tables with autocomplete:
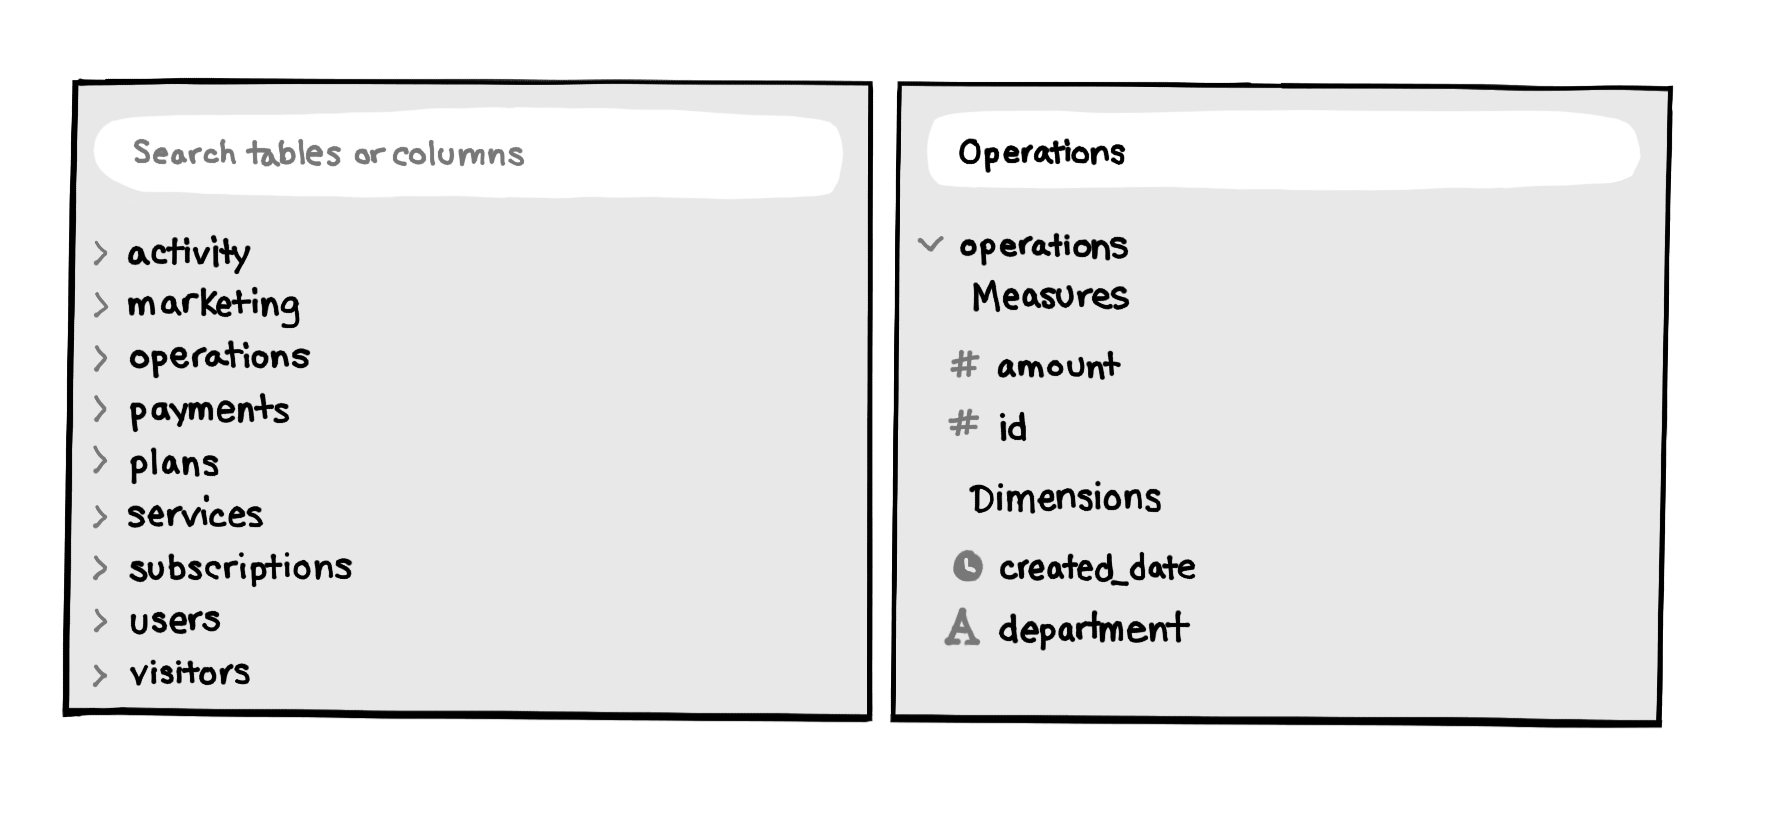
When you find something promising such as a table with the same keyword you searched for, or one that contains a field that matches your keyword, run a quick query:
SELECT *
FROM operations
LIMIT 3;

Once you get the results, you can quickly see if it has relevant information. In this case, we can see that the table has a department column that looks appropriate, and the amount column may be the cost data we are looking for. If a table such as this one looks relevant to one of the metrics, write it down or put it directly in the Metrics Spreadsheet.
Your next step will be to determine what data you cannot find yourself. If you find a table, but are unsure if it is the correct data, put the name of the table in with a ? at the end. If you cannot find any relevant tables for a metric put three ? in the Metrics Spreadsheet.
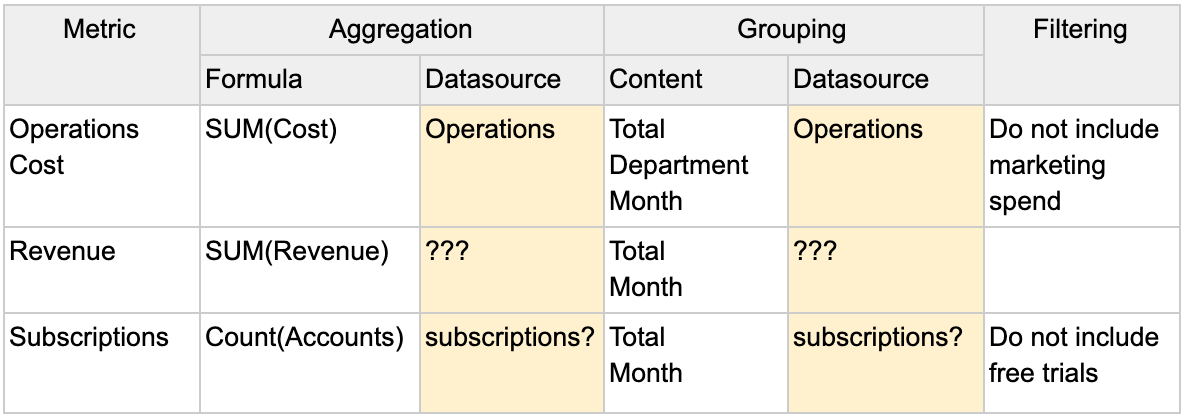
If you have any questions about the tables or columns you have found, it is time to consult the Data Gatekeeper. I’d highly recommend going to the Data Gatekeeper with the list of tables and fields you have questions about, using the Metrics Spreadsheet as a convenient way to structure the conversation.
Go through each metric with the Data Gatekeeper, and explain what tables and fields you think you should be using and which ones you have questions about.
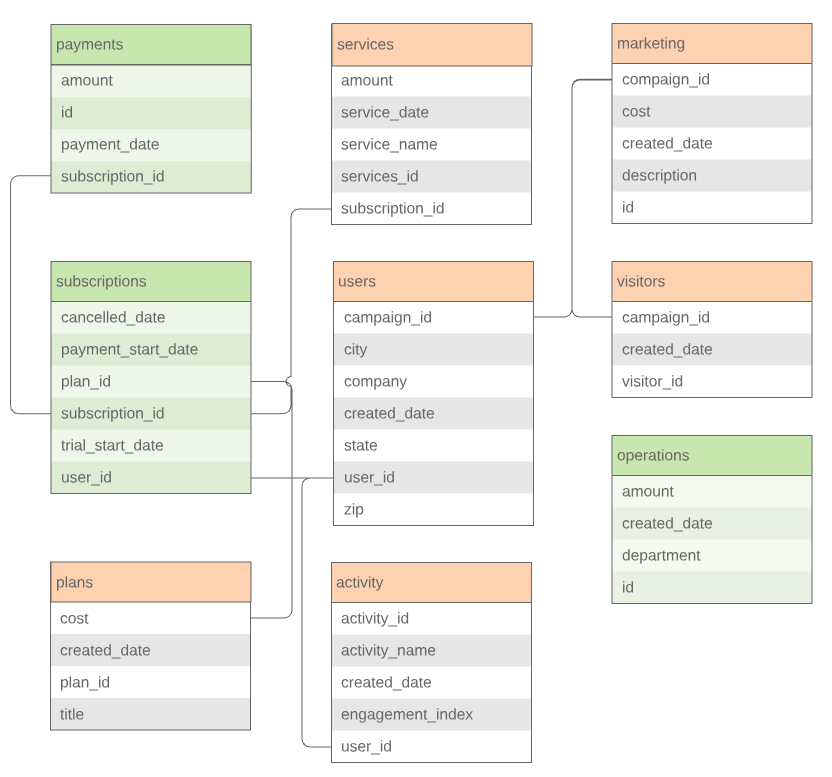
The Data Gatekeeper will confirm the tables and fields you have selected so far or will help you locate the tables and fields you need. You might not be able to access some of the data you need due to access permissions. The Data Gatekeeper may grant you access, help create the query, or will provide feedback about how to work around this limitation. After locating the relevant tables, update the Metrics Spreadsheet.

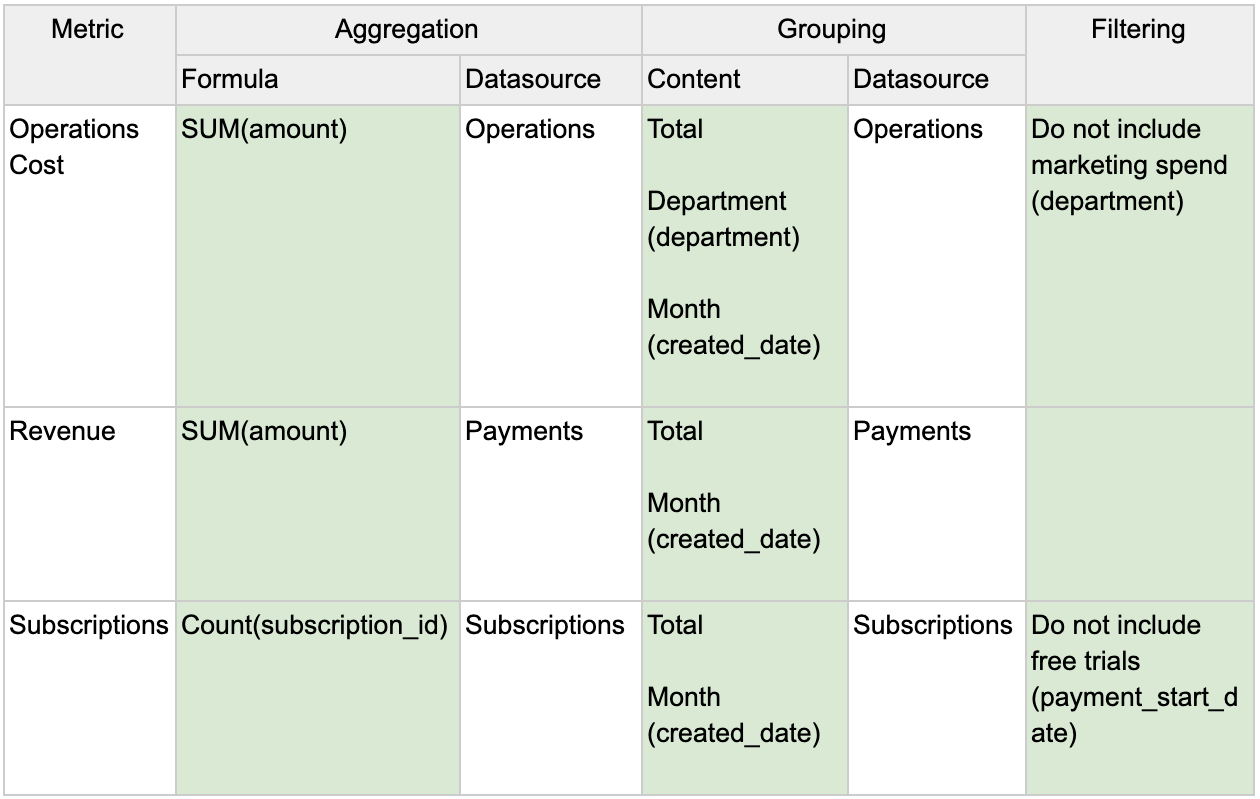
We also need to specify the fields within the tables that will be used to make creating the SQL queries easy. Place the field names in parentheses below your grouping categories in the Content column. Notice ‘Total’ does not have a column associated with it because it is aggregating the full table.
When you have messy data
Most data is messy data. It may have obvious issues such as missing values. It may have more mysterious issues, such as obvious typos from manual input, or worse, ambiguous values. Whatever the cause, all these issues need to be addressed or documented before being used in a visualization.
Missing values
On any column that you will be using in a metric calculation, you should check for Nulls and blank records. Here is an example query to get the total number of Nulls:
SELECT COUNT(*)
FROM table
WHERE field is null
To check for blank values we can use:
SELECT COUNT(*)
FROM table
WHERE field = '' or field = ' '
You need to evaluate how to treat missing values.
Ignore - leave the values as they are
- This is the most common approach to dealing with missing data. Note the amount of missing values that exist and move on.
- If there are high amounts of missing data in a field it is not recommended to use it in a calculation since it may no longer be representative of that field.
Delete - remove any records with missing data
- Deletion is only recommended if the records are a very small minority of the data set so their removal does not skew the data.
- One legitimate reason for removing a record due to a missing value is if it has missing values in multiple fields.
Impute - replace the missing value with a value
- If the data is relatively normally distributed, replacing the value with the average or median can be done if there are only a few records missing the value. This will bias the distribution more towards the center so be cautious.
- In some cases it is clear that leaving a field blank might indicate that the true value is 0. In these cases it is appropriate to impute with a 0.
Regardless of which option you choose, be sure to have the decision documented so others can reproduce the calculation and understand if they should take the data they are seeing to be 100% accurate or not.
Obviously Wrong Values
On any column that you will be using in a metric calculation, you should also check for bizarre values. Do a quick check for the highest and lowest values of any of the fields that will be used. You can do this using the ORDER BY clause.
SELECT *
FROM table
ORDER BY field DESC
SELECT *
FROM table
ORDER BY field ASC
This will quickly surface values that are way off from others in the field.
In text fields this is obviously wrong values are difficult to detect since the mistakes may not show at the beginning or end of an ordered list. However there are a few common things to check for:
Phone Number
- Common fake numbers: 123-456-7890, 000-000-0000, and 999-999-9999
Name
- Common fake names: John Doe, Jane Doe,
- Repetitive letters such as ‘aa’,’bb’
Birthday
- Too old: Over 100 years ago
- Too young: Less than 13 years ago
Potentially Wrong Values
While the previous method dealt with obviously wrong values there can be more subtle outliers and potentially wrong values that you may want to address.
For instance we will demonstrate one method of determining outliers using the interquartile range method. First we need to establish quartiles within the data. Quartiles split a quantitative variable up into four equal sections. The interquartile range (IQR) is the difference between the upper quartile (Q3) and the lower quartile (Q1), which cover the central 50% of the data. If a value is far enough from the middle, we might consider that an outlier.
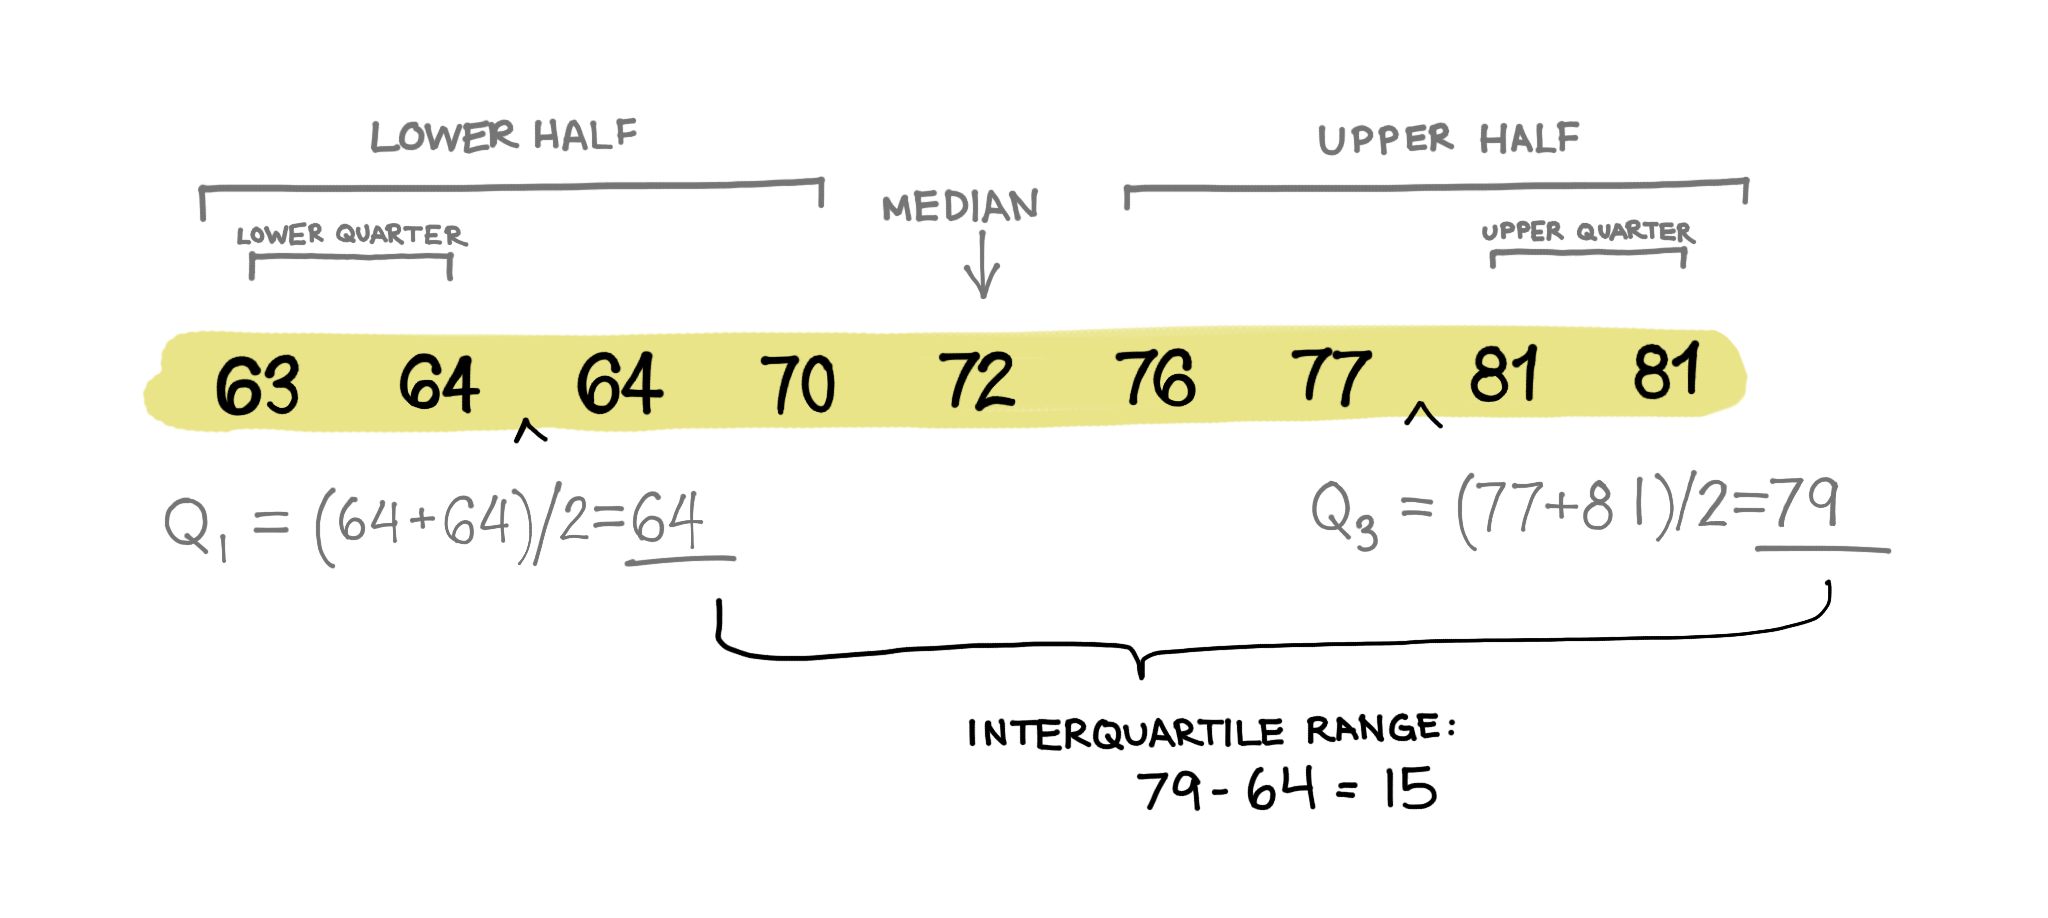
A commonly accepted definition of an outlier is 1.5 * IQR + Q3 or Q1 - 1.5 * IQR. In essence, if a data point is 1.5 times the IQR larger than the upper quartile, or 1.5 times the IQR smaller than the lower quartile, it is an outlier value.
Here is an example query applying this formula to find outliers using IQR.
WITH orderedlist
     AS (SELECT Row_number()
                  OVER(
                    ORDER BY amount)AS num,
                quantity
         FROM   table)
SELECT num,
       quantity
FROM   orderedlist
WHERE  num > Floor((SELECT Count(*) AS c
                    FROM   table) * 0.75 + ( Floor((SELECT Count(*) AS c
                                                    FROM   table) * 0.75)
                                             - Floor(
                                             (SELECT Count(*) AS c
                                              FROM   table) * 0.25) ))
        OR num < Floor((SELECT Count(*) AS c
                        FROM   table) * 0.25 - ( Floor((SELECT Count(*) AS c
                                                        FROM   table) * 0.75)
                                                 - Floor(
                                                 (SELECT Count(*) AS c
                                                  FROM   table) * 0.25) ))
In text fields, potentially wrong values are more difficult to detect. Watch out for the following:
Misspellings
- Slight errors will affect a query’s grouping or filtering: ‘Hamburger’, ‘Hamburdr’, ‘Hanburger’
Various capitalization
- Any difference could affect a query’s grouping or filtering: ‘Hamburger’, ‘HamBurger’, ‘hamburger’’
SQL will treat each of these variations as unique. One way to detect these is by grouping by the column the text values are in and reviewing any groups with very few records in them. These will most likely be misspelled versions of bigger categories.
When you have no data

Sometimes you do not have the data in your database for your metric. This can be a huge roadblock but there are a few ways forward. First, we need to know:
- Do we care about historical data?
- Is the metric actually trackable?
- How much data is needed for this metric to be valuable?
With these answers we can solve the problem in a few different ways.
Instrumenting new data points
If historical data is of no concern, consider working with the Data Gatekeeper to start to tracking the data for the metrics you want. This might involve engineering to implement the new tracking. Based on the engineering resources available to help, this may delay completion of the dashboarding project.
If the metric desired here is for a statistical test, talk with the Data Gatekeeper about how much data will be necessary to do the test properly. Factor in how much time it will take to get that data and let the Point Person know. Often times, people will want to draw conclusions as quickly as possible, before there has been enough data to be confident in the results. Do not let your dashboard get used incorrectly like this. Set time expectations up front when instrumenting new data points and perhaps even note on the dashboard when conclusions can be drawn.
Proxy Metrics
If we want historical data but we do not have the data for the metric we wanted, we can use proxy metrics. Proxy metrics are metrics that give us the same or similar information to what we wanted, when we can’t directly measure the desired metric.
Example:
The Point Person wants to know what customers think of the product.
Desired Metric: NPS
- This has not been implemented yet and is reliant on people filling out a form so there might not be a lot of data to draw conclusions from.
Proxy Metric: Return Visitors
- We could look at how often customers use the product as a proxy metric. In this case, we equivocate regular usage with our customers liking the product.
While proxy metrics are not exact, they can give us a good estimation. Be careful when using proxy metrics, however, since they may be measuring things you do not expect and can lead you to make bad decisions.
Proxy Metric example
Consider a company who has to wait a long time to see if their product was valuable to the consumer such as an education company. They provide a lot of knowledge to students, but if their ultimate goal is job placement they have to wait several months to know if their education was effective.
How can they measure if they are doing a good job before their desired metric event happens?
You could introduce surveys to measure how confident students are in their job prospects, you could measure graduation rates, or you could measure the amount of inbound interest in your students from outside employers. Each one of these Proxy Metrics which you might be able to assess sooner than the “did they get a job” metric will lead you to focus on different activities.
Summary
- Finding where the data is located can be challenging.
- Most likely you will need to involve the Data Gatekeeper in your search. Be prepared with what data you are looking for before engaging with them.
- Sometimes you will not be able to find data due to your level of access and will need to consult with the Data Gatekeeper.
- Fill out your metric architecture to know which tables and fields will be necessary for each metric.
- Determine how messy your data is and clean it appropriately
- If you do not have the data for a metric, work with the Data Gatekeeper to instrument new data points or use a proxy metric.
Written by:
Matt David
Reviewed by:
Mike Yi
,
Dave Fowler
,
Tim Miller
