Scaling Dashboards
Last modified: February 15, 2020

Once your dashboard is in front of it’s full audience how the dashboard is used is likely to evolve. This can be an expansion of decisions they would like to see supported or the number of groups who want to use it for their specific scenarios. To accommodate these changes there are some scaling strategies to consider using.
Linking out
When there is a lot of feedback around drilling in to one chart or seeing the information displayed in greater detail consider designing a new dashboard for this. You can then provide links on the original dashboard to navigate to these new more granular dashboards.

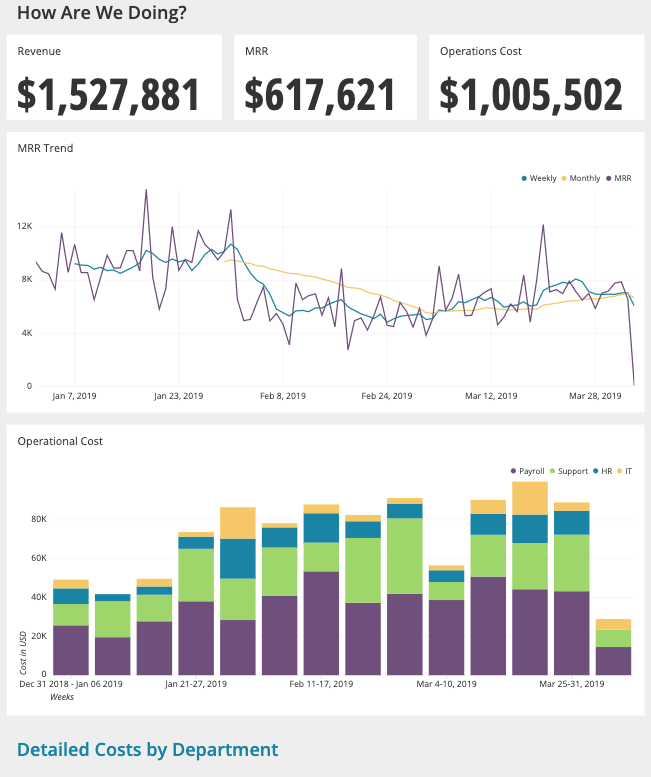
Here we have an example where at the bottom there is blue text that links out to another dashboard. Not all BI tools provide this functionality but it is critical to helping your audience navigate the data. Since otherwise they may need to remember the name of specific dashboards or look through a long list to find what they want.
There are also technical benefits to linking out. Linking out keeps the number of queries limited per dashboard which makes the dashboard load quickly.
Interactivity
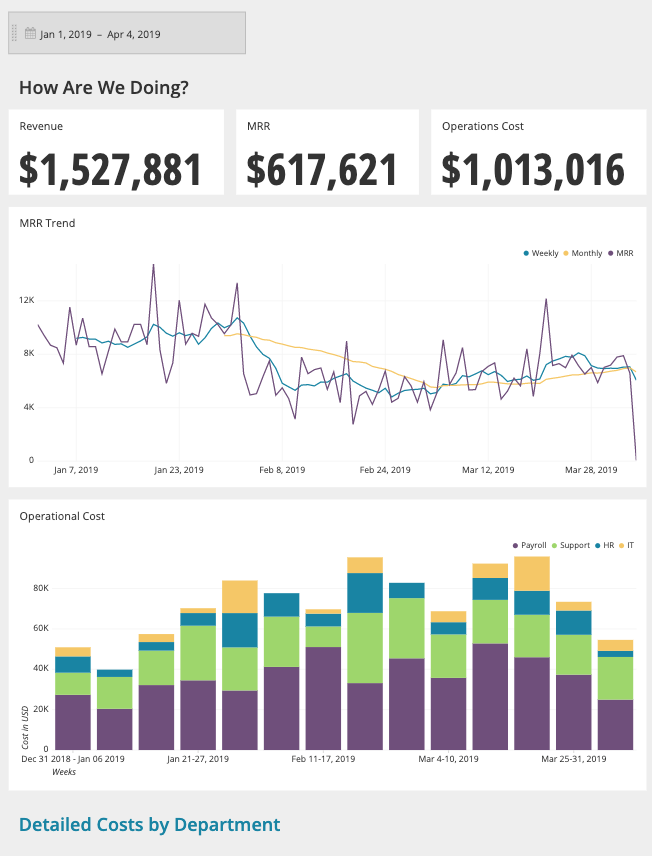
If the feedback for the dashboard is to support more groups’ specific scenarios you will need to incorporate interactive features. This means having dropdowns for variables so that multiple situations can be evaluated using the same framework of the dashboard. This is most commonly used to be able to change the date range of the data in the dashboard.

Here we have an example where at the top there is an interactive element to change the date range we are viewing.
If you add multiple interactive elements to a dashboard it is a best practice to turn off any auto refresh so that you are not running all the queries for each filter being applied. Instead limit the refresh to occur after confirming your interactive settings so that the query will only be run once. Another way to address this potential performance issue is to cache the data so that the filters are only hitting that data instead of querying your database.
Optimization
Regardless of how it evolves, if the usage on a dashboard is high the demand on your database will increase. You need to ensure the dashboard still loads quickly and that the work placed on the database is mitigated. This can be accomplished by:
- Optimizing queries
- Setting the schedule
- Removing unused queries
Optimizing queries
If a query takes longer than 30 seconds to complete, there likely can be something done to optimize your query. If aggregations are taking a long time, go to the Data Gatekeeper to discuss creating a pre-aggregated table that you can query from. This sort of data modeling can drastically improve query performance.
In addition, leave any data manipulation (truncation, casting, etc) until after the aggregation. This means that you will aggregate the data first and then apply the transformations to the aggregated data.
Here we can see an example of casting before and after and aggregation:
SELECT SUM(num), category
FROM table
GROUP BY CAST(category AS VARCHAR)
SELECT SUM(num), CAST(category AS VARCHAR)
FROM table
GROUP BY category
This is much more efficient than making the change to every record before aggregation. You can check out more Query optimization strategies here: Optimize your SQL Query
Setting the schedule
Most business dashboards are not using real time data. Data is delivered to the data warehouse where you are querying from on a schedule in batches. This schedule is set up by the Data Gatekeeper. You should ask them what this schedule is for the data sources you are using and then set expectations with the audience about how “live” the data really is. You can also help people with interpreting the data correctly by setting the default date range to fit this schedule. Commonly people will set the date range to be up to the day before to make sure the data being seen is accurate.
You can also discuss with the Data Gatekeeper the speed at which people need to make decisions based on the data so they can adjust the schedule for when data is loaded into the data warehouse.
Removing unused dashboards
Regularly archive dashboards that have not been viewed in over 90 days, these are likely not providing value even at a quarterly planning level. All dashboards are querying the database, the more dashboards are querying the database the slower it gets for everyone. Before archiving send out an email alerting people which dashboards will be archived so they can respond and flag any that shouldn’t.
Documentation
Beyond the audience there is another consumer of your dashboard. This is future analysts who are trying to build their own dashboards. Do the future analysts a favor and document your queries so that they can be understood easily and any quirks can be identified quickly. This can be done using comments in SQL or comments within the dashboard.
Another roadblock to clear for future analysts is to make sure that other people have access to your queries and the data sources you used so they can leverage them for other dashboard. This may require talking with the data gatekeeper to change default permissions on different data sources. Overall you want to make it easier fo the next person to navigate the data and find insights.
Summary
- Link out to support more decisions
- Add interactivity to accommodate more individuals/groups needing to make the same decisions
- Set a refresh rate that mimics the rate of decision making so that it is not refreshing more than necessary
- Document your work so that you and others can learn from your query decisions in the future.
Written by:
Matt David
Reviewed by:
