Correlation and P value
Last modified: December 09, 2019
The two most commonly used statistical tests for establishing relationship between variables are correlation and p-value. Correlation is a way to test if two variables have any kind of relationship, whereas p-value tells us if the result of an experiment is statistically significant. In this tutorial, we will be taking a look at how they are calculated and how to interpret the numbers obtained.
What is correlation?
Correlation coefficient is used in statistics to measure how strong a relationship is between two variables. There are several types of correlation coefficients (e.g. Pearson, Kendall, Spearman), but the most commonly used is the Pearson’s correlation coefficient. This coefficient is calculated as a number between -1 and 1 with 1 being the strongest possible positive correlation and -1 being the strongest possible negative correlation.
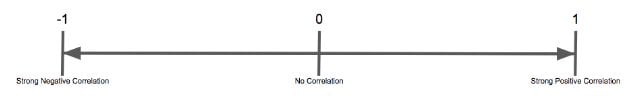
A positive correlation means that as one number increases the second number will also increase. A negative correlation means that as one number increases the second number decreases. However, correlation does not always imply causation — correlation does not tell us whether change in one number is directly caused by the other number, only that they typically move together. Learn more about the Pearson correlation formula, and how to implement it in SQL here. To understand how correlation works, let’s look at a chart of height vs weight.
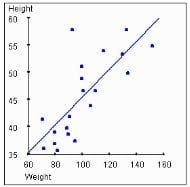
We can observe that with increase in weight, the height also increases – which indicates they are positively correlated. Also, the correlation coefficient in this case is 0.88, which supports our finding. Learn more about correlation and how to implement it in Excel here.
What is a p-value?
P-value evaluates how well your data rejects the null hypothesis, which states that there is no relationship between two compared groups. Successfully rejecting this hypothesis tells you that your results may be statistically significant. In academic research, p-value is defined as the probability of obtaining results ‘as extreme’ or ‘more extreme’, given that the null hypothesis is true — essentially, how likely it is that you would receive the results (or more dramatic results) you did assuming that there is no correlation or relationship (e.g. the thing that you’re testing) among the subjects. To understand what this means, let us look at an example.
We are going to conduct an experiment to check if a coin is biased or not. To do this, let’s flip a coin 10 times. Intuitively, we can say that the probability of getting 5 heads and 5 tails is highest, followed by 6 heads and 4 tails or 6 tails and 4 heads, and so on. So first, let’s state the null and alternate hypothesis. Since the assumption is that the coin is fair, our null hypothesis is “The coin is unbiased with equal probability of heads and tails”. We are conducting the experiment to prove/disprove the claim, so our alternative hypothesis is “The coin is biased with unequal probability of heads and tails”
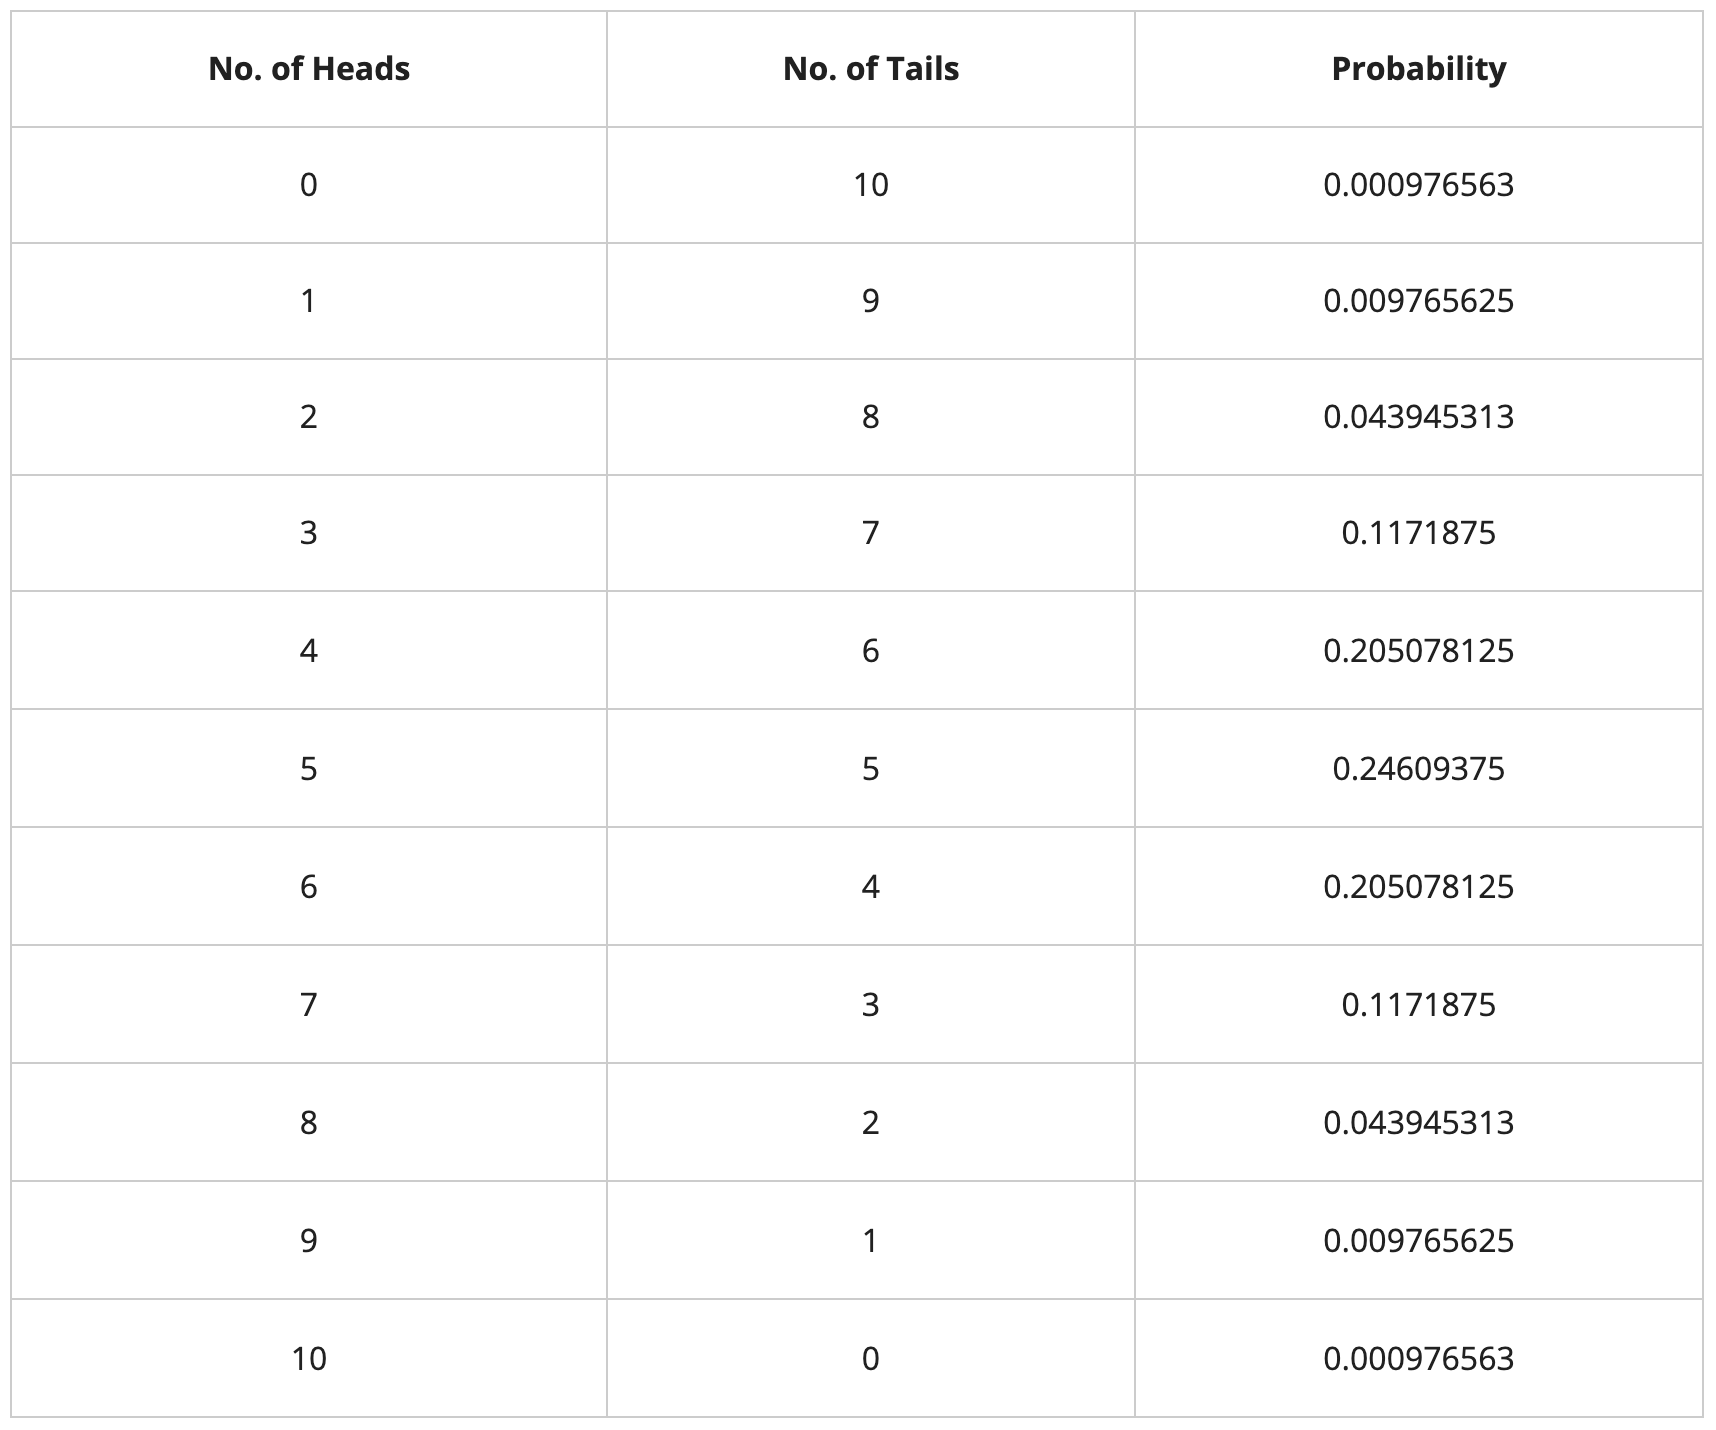
Assuming the null hypothesis is true (the coin is fair), let’s calculate the probabilities of the various possible outputs i.e 0 heads & 10 tails, 1 head & 9 tails, 2 heads & 8 tails, and so on.
The probabilities are calculated using the probability of a binomial distribution, which gives the probability of r successes in n trials using the formula :
nCr * (p)r * (1-p)n-r
Where,
n = no. of trials = 10
r = no. of successes (heads)
p = probability of a success = 1/2
1-p = probability of a failure = 1/2
Let’s consider a ‘success’ to be when heads appears in the coin toss. Also, it won’t make a difference if ‘success’ is considered to be heads or tails. Let’s first calculate the probability of obtaining 5 heads and 5 tails in 10 coin flips.
P(5 heads and 5 tails) = 10C5 * (½)5 * (½)5 = 0.24609375
Similarly, let’s generate the probabilities of all other possible combinations of heads and tails:
Let’s plot the probabilities to understand the intuition behind the above calculation:
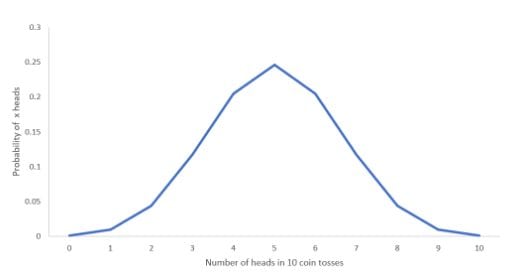
We can observe from the chart that the probability of getting 5 heads is the highest, and the probability of getting 0 heads or 0 tails is the lowest. Now, let’s assume we get the output of this experiment as “9 heads and 1 tail”.
Let us calculate the p-value of the experiment. To reiterate the definition – “p value is the probability of obtaining results as extreme or more extreme, given the null hypothesis is true”.
Now, we add the probabilities of all the possible outputs of the experiment which are as probable as ‘9 heads and 1 tail’ and less probable than ‘9 heads and 1 tail’.
P-value = P(9 heads and 1 tail) + P(10 heads and 0 tail) + P(9 tails and 1 head) + P(10 tails and 0 heads)
= 0.009765625 + 0.000976563 + 0.009765625 + 0.000976563 = 0.02148437 = 0.02 (approx.)
Now, we need to check whether the p-value is significant or not. This is done by specifying a significance cutoff, known as the alpha value. Alpha is usually set to 0.05, meaning the probability of achieving the same or more extreme results assuming the null hypothesis is 5%. If the p-value is less than the specified alpha value, then we reject the null hypothesis. Hence, we reject the hypothesis that ““The coin is fair with equal probability of heads and tails” and conclude that the coin is biased.
Conclusion
Though correlation and p-value provides us with the relationship between variables, care should be taken to interpret them correctly. Correlation tells us whether two variables have any sort of relationship and it does not imply causation. If two variables A and B are highly correlated, there are several possible explanations: (a) A influences B; (b) B influences A; (c) A and B are influenced by one or more additional variables; (d) the relationship observed between A and B was a chance error. Similarly, p-value should not be misused to produce a statistically significant result. If analysis is done by exhaustively searching various combinations of variables for correlation, then it is known as p-hacking.
Written by:
Rohan Joseph
Reviewed by: